
Page 884 - Krugmans Economics for AP Text Book_Neat
P. 884
S-38 SOLUTIONS TO AP REVIEW QUESTIONS
Tackle the Test:
Multiple-Choice Questions
1. d
2. b
3. a
4. e
5. b
Tackle the Test:
Free-Response Questions
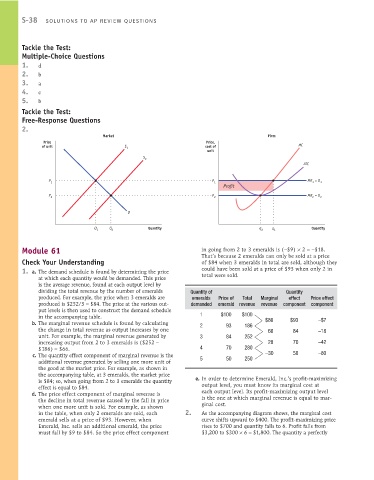
2.
Market Firm
Price Price,
of unit S 1 cost of MC
unit
S 2
ATC
P 1 P 1 MR = D 1
1
Profit
P 2 P 2 MR = D 2
2
D
Q 1 Q 2 Quantity q 2 q 1 Quantity
Module 61 in going from 2 to 3 emeralds is (−$9) × 2 =−$18.
That’s because 2 emeralds can only be sold at a price
Check Your Understanding of $84 when 3 emeralds in total are sold, although they
could have been sold at a price of $93 when only 2 in
1. a. The demand schedule is found by determining the price
at which each quantity would be demanded. This price total were sold.
is the average revenue, found at each output level by
dividing the total revenue by the number of emeralds Quantity of Quantity
produced. For example, the price when 3 emeralds are emeralds Price of Total Marginal effect Price effect
produced is $252/3 = $84. The price at the various out- demanded emerald revenue revenue component component
put levels is then used to construct the demand schedule
in the accompanying table. 1 $100 $100
b. The marginal revenue schedule is found by calculating 2 93 186 $86 $93 −$7
the change in total revenue as output increases by one 66 84 −18
unit. For example, the marginal revenue generated by 3 84 252
increasing output from 2 to 3 emeralds is ($252 − 28 70 −42
$186) = $66. 4 70 280
c. The quantity effect component of marginal revenue is the 5 50 250 −30 50 −80
additional revenue generated by selling one more unit of
the good at the market price. For example, as shown in
the accompanying table, at 3 emeralds, the market price
is $84; so, when going from 2 to 3 emeralds the quantity e. In order to determine Emerald, Inc.’s profit-maximizing
effect is equal to $84. output level, you must know its marginal cost at
d. The price effect component of marginal revenue is each output level. Its profit-maximizing output level
the decline in total revenue caused by the fall in price is the one at which marginal revenue is equal to mar-
when one more unit is sold. For example, as shown ginal cost.
in the table, when only 2 emeralds are sold, each 2. As the accompanying diagram shows, the marginal cost
emerald sells at a price of $93. However, when curve shifts upward to $400. The profit-maximizing price
Emerald, Inc. sells an additional emerald, the price rises to $700 and quantity falls to 6. Profit falls from
must fall by $9 to $84. So the price effect component $3,200 to $300 × 6 = $1,800. The quantity a perfectly