
Page 69 - Sample Financial Plan 4-1-2019 v2
P. 69
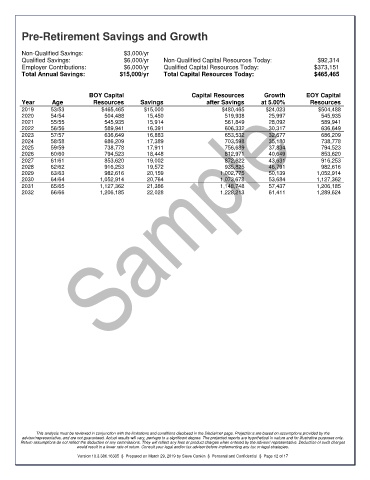
Pre-Retirement Savings and Growth


        Non-Qualified Savings:            $3,000/yr
        Qualified Savings:                $6,000/yr     Non-Qualified Capital Resources Today:            $92,314
        Employer Contributions:           $6,000/yr     Qualified Capital Resources Today:               $373,151
        Total Annual Savings:            $15,000/yr     Total Capital Resources Today:                   $465,465


                               BOY Capital                      Capital Resources       Growth        EOY Capital
        Year      Age           Resources      Savings               after Savings     at 5.00%         Resources
        2019      53/53            $465,465      $15,000                  $480,465       $24,023          $504,488
        2020      54/54             504,488       15,450                   519,938        25,997           545,935
        2021      55/55             545,935       15,914                   561,849        28,092           589,941
        2022      56/56             589,941       16,391                   606,332        30,317           636,649
        2023      57/57             636,649       16,883                   653,532        32,677           686,209
        2024      58/58             686,209       17,389                   703,598        35,180           738,778
        2025      59/59             738,778       17,911                   756,689        37,834           794,523
        2026      60/60             794,523       18,448                   812,971        40,649           853,620
        2027      61/61             853,620       19,002                   872,622        43,631           916,253
        2028      62/62             916,253       19,572                   935,825        46,791           982,616
        2029      63/63             982,616       20,159                  1,002,775       50,139          1,052,914
        2030      64/64           1,052,914       20,764                  1,073,678       53,684          1,127,362
        2031      65/65           1,127,362       21,386                  1,148,748       57,437          1,206,185
        2032      66/66           1,206,185       22,028                  1,228,213       61,411          1,289,624


             This analysis must be reviewed in conjunction with the limitations and conditions disclosed in the Disclaimer page. Projections are based on assumptions provided by the
        advisor/representative, and are not guaranteed. Actual results will vary, perhaps to a significant degree. The projected reports are hypothetical in nature and for illustrative purposes only.
        Return assumptions do not reflect the deduction of any commissions. They will reflect any fees or product charges when entered by the advisor/ representative. Deduction of such charges
                          would result in a lower rate of return. Consult your legal and/or tax advisor before implementing any tax or legal strategies.

                           Version 10.3.386.16335  §  Prepared on March 29, 2019 by Steve Conkin  §  Personal and Confidential  §  Page 12 of 17