
Page 4 - Quarterly Financial Report 2020
P. 4
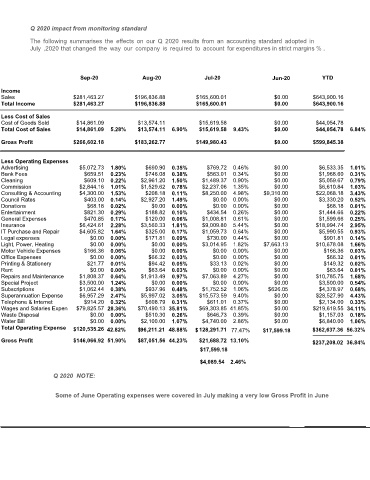
Q 2020 impact from monitoring standard

           The  following  summarises  the  effects  on  our  Q  2020  results  from  an  accounting  standard  adopted  in
           July  ,2020 that changed  the  way  our  company  is  required  to  account  for expenditures in strict margins % .


                            Sep-20              Aug-20               Jul-20                Jun-20           YTD

  Income
  Sales                  $281,463.27          $196,836.88         $165,600.01               $0.00        $643,900.16
  Total Income           $281,463.27          $196,836.88         $165,600.01               $0.00        $643,900.16
  Less Cost of Sales
  Cost of Goods Sold      $14,861.09           $13,574.11          $15,619.58               $0.00         $44,054.78
  Total Cost of Sales     $14,861.09  5.28%    $13,574.11  6.90%   $15,619.58  9.43%        $0.00         $44,054.78  6.84%
  Gross Profit           $266,602.18          $183,262.77         $149,980.43               $0.00        $599,845.38


  Less Operating Expenses
  Advertising              $5,072.73  1.80%      $690.90  0.35%      $769.72  0.46%         $0.00          $6,533.35  1.01%
  Bank Fees                  $659.51  0.23%      $746.08  0.38%      $563.01  0.34%         $0.00          $1,968.60  0.31%
  Cleaning                   $609.10  0.22%     $2,961.20  1.50%    $1,489.37  0.90%        $0.00          $5,059.67  0.79%
  Commission               $2,844.16  1.01%     $1,529.62  0.78%    $2,237.06  1.35%        $0.00          $6,610.84  1.03%
  Consulting & Accounting  $4,300.00  1.53%      $208.18  0.11%     $8,250.00  4.98%    $9,310.00         $22,068.18  3.43%
  Council Rates              $403.00  0.14%     $2,927.20  1.49%       $0.00  0.00%         $0.00          $3,330.20  0.52%
  Donations                   $68.18  0.02%        $0.00  0.00%        $0.00  0.00%         $0.00            $68.18  0.01%
  Entertainment              $821.30  0.29%      $188.82  0.10%      $434.54  0.26%         $0.00          $1,444.66  0.22%
  General Expenses           $470.85  0.17%      $120.00  0.06%     $1,008.81  0.61%        $0.00          $1,599.66  0.25%
  Insurance                $6,424.61  2.28%     $3,560.33  1.81%    $9,009.80  5.44%        $0.00         $18,994.74  2.95%
  IT Purchase and Repair   $4,605.82  1.64%      $325.00  0.17%     $1,059.73  0.64%        $0.00          $5,990.55  0.93%
  Legal expenses               $0.00  0.00%      $171.81  0.09%      $730.00  0.44%         $0.00           $901.81  0.14%
  Light, Power, Heating        $0.00  0.00%        $0.00  0.00%     $3,014.95  1.82%    $7,663.13         $10,678.08  1.66%
  Motor Vehicle Expenses     $166.36  0.06%        $0.00  0.00%        $0.00  0.00%         $0.00           $166.36  0.03%
  Office Expenses              $0.00  0.00%       $66.32  0.03%        $0.00  0.00%         $0.00            $66.32  0.01%
  Printing & Stationery       $21.77  0.01%       $94.42  0.05%       $33.13  0.02%         $0.00           $149.32  0.02%
  Rent                         $0.00  0.00%       $63.64  0.03%        $0.00  0.00%         $0.00            $63.64  0.01%
  Repairs and Maintenance  $1,808.37  0.64%     $1,913.49  0.97%    $7,063.89  4.27%        $0.00         $10,785.75  1.68%
  Special Project          $3,500.00  1.24%        $0.00  0.00%        $0.00  0.00%         $0.00          $3,500.00  0.54%
  Subscriptions            $1,062.44  0.38%      $937.96  0.48%     $1,752.52  1.06%      $626.05          $4,378.97  0.68%
  Superannuation Expense   $6,957.29  2.47%     $5,997.02  3.05%   $15,573.59  9.40%        $0.00         $28,527.90  4.43%
  Telephone & Internet       $914.20  0.32%      $608.79  0.31%      $611.01  0.37%         $0.00          $2,134.00  0.33%
  Wages and Salaries Expen  $ 79,825.57 28.36%  $70,490.13 35.81%  $69,303.85 41.85%        $0.00        $219,619.55 34.11%
  Waste Disposal               $0.00  0.00%      $510.30  0.26%      $646.73  0.39%         $0.00          $1,157.03  0.18%
  Water Bill                   $0.00  0.00%     $2,100.00  1.07%    $4,740.00  2.86%        $0.00          $6,840.00  1.06%
  Total Operating Expense  $120,535.26 42.82%  $96,211.21 48.88%  $ 128,291.71 77.47%   $17,599.18      $362,637.36  56.32%

  Gross Profit           $146,066.92 51.90%    $87,051.56 44.23%   $21,688.72 13.10%                    $237,208.02  36.84%
                                                                   $17,599.18

                                                                   $4,089.54  2.46%

                   Q 2020  NOTE:


                      Some of June Operating expenses were covered in July making a very low Gross Profit in June