
Page 90 - NIB Annual Report 12-13 | 13-14
P. 90
TURKS AND CAICOS ISLANDS NATIONAL INSURANCE BOARD
Notes to Financial Statements, continued Year ended March 31, 2013
25. Financial instruments, continued
(c) Market risk, continued (iii) Fair value
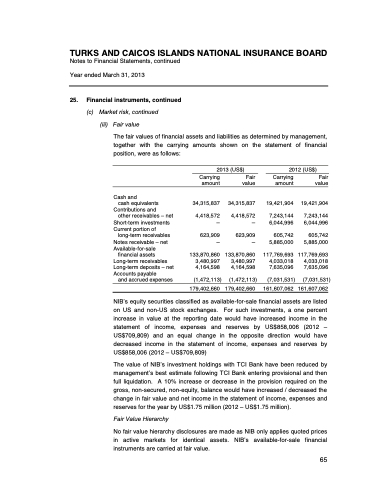
The fair values of financial assets and liabilities as determined by management, together with the carrying amounts shown on the statement of financial position, were as follows:
2013 (US$)
2012 (US$)
Cash and
cash equivalents
Contributions and
other receivables – net
Short-term investments Current portion of
long-term receivables Notes receivable – net Available-for-sale
financial assets Long-term receivables Long-term deposits – net Accounts payable
and accrued expenses
Carrying amount
34,315,837
4,418,572 –
623,909 –
133,870,860 3,480,997 4,164,598
Fair value
34,315,837
4,418,572 –
623,909 –
133,870,860 3,480,997 4,164,598
Carrying amount
19,421,904
7,243,144 6,044,996
605,742 5,885,000
117,769,693 4,033,018 7,635,096
Fair value
19,421,904
7,243,144 6,044,996
605,742 5,885,000
117,769,693 4,033,018 7,635,096
(1,472,113)
179,402,660 179,402,660 161,607,062 161,607,062
(1,472,113)
(7,031,531)
(7,031,531)
86 | The National Insurance Board of The Turks and Caicos Islands
65
NIB’s equity securities classified as available-for-sale financial assets are listed on US and non-US stock exchanges. For such investments, a one percent increase in value at the reporting date would have increased income in the statement of income, expenses and reserves by US$858,006 (2012 – US$709,809) and an equal change in the opposite direction would have decreased income in the statement of income, expenses and reserves by US$858,006 (2012 – US$709,809)
The value of NIB’s investment holdings with TCI Bank have been reduced by management’s best estimate following TCI Bank entering provisional and then full liquidation. A 10% increase or decrease in the provision required on the gross, non-secured, non-equity, balance would have increased / decreased the change in fair value and net income in the statement of income, expenses and reserves for the year by US$1.75 million (2012 – US$1.75 million).
Fair Value Hierarchy
No fair value hierarchy disclosures are made as NIB only applies quoted prices
in active markets for identical assets. NIB’s available-for-sale financial
instruments are carried at fair value.
