
Page 57 - SEC_2017WorkingDocument_Neat
P. 57
candidates worked in groups consisting of at least two persons and submitted one SBA
project.
29. On-site moderation was implemented for Integrated Science and Technical Drawing
in 2017. Agricultural Science, Biology, Chemistry, Industrial Technology, Music and Physics
continued to be moderated on-site.
30. Random Sampling was again conducted in the following subjects: Caribbean History,
Principles of Accounts, Principles of Business and Technical Drawing. Centres were only
required to submit samples for these subjects if requested specifically by CXC. Complete lists
of the samples requested were forwarded to each Local Registrar via email in February 2017.
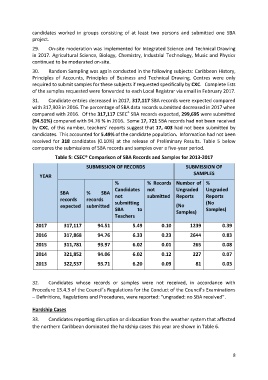
31. Candidate entries decreased in 2017, 317,117 SBA records were expected compared
with 317,903 in 2016. The percentage of SBA data records submitted decreased in 2017 when
®
compared with 2016. Of the 317,117 CSEC SBA records expected, 299,695 were submitted
(94.51%) compared with 94.76 % in 2016. Some 17, 721 SBA records had not been received
by CXC, of this number, teachers’ reports suggest that 17, 403 had not been submitted by
candidates. This accounted for 5.49% of the candidate population. Information had not been
received for 318 candidates (0.10%) at the release of Preliminary Results. Table 5 below
compares the submissions of SBA records and samples over a five-year period.
Table 5: CSEC® Comparison of SBA Records and Samples for 2013-2017
SUBMISSION OF RECORDS SUBMISSION OF
SAMPLES
YEAR
% % Records Number of %
Candidates not Ungraded Ungraded
SBA % SBA
not submitted Reports Reports
records records submitting (No
expected submitted (No
SBA to Samples) Samples)
Teachers
2017 317,117 94.51 5.49 0.10 1239 0.39
2016 317,868 94.76 6.33 0.23 2644 0.83
2015 311,781 93.97 6.02 0.01 265 0.08
2014 321,852 94.06 6.02 0.12 227 0.07
2013 322,537 93.71 6.20 0.09 81 0.03
32. Candidates whose records or samples were not received, in accordance with
Procedure 13.4.3 of the Council’s Regulations for the Conduct of the Council’s Examinations
– Definitions, Regulations and Procedures, were reported: “ungraded: no SBA received”.
Hardship Cases
33. Candidates reporting disruption or dislocation from the weather system that affected
the northern Caribbean dominated the hardship cases this year are shown in Table 6.
8