
Page 58 - SEC_2017WorkingDocument_Neat
P. 58
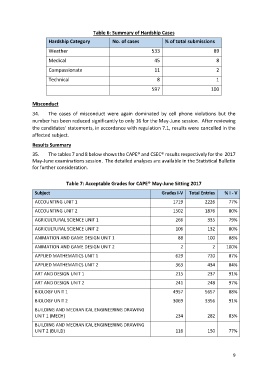
Table 6: Summary of Hardship Cases

                       Hardship Category           No. of cases           % of total submissions

                       Weather                                      533                         89
                       Medical                                        45                         8

                       Compassionate                                  11                         2

                       Technical                                       8                         1

                                                                    597                        100


               Misconduct

               34.     The  cases  of  misconduct  were  again  dominated  by  cell  phone  violations  but  the
               number has been reduced significantly to only 16 for the May-June session.  After reviewing
               the candidates’ statements, in accordance with regulation 7.1, results were cancelled in the
               affected subject.

               Results Summary
               35.     The tables 7 and 8 below shows the CAPE® and CSEC® results respectively for the  2017
               May-June examinations session.  The detailed analyses are available in the Statistical Bulletin
               for further consideration.

                               Table 7: Acceptable Grades for CAPE® May-June Sitting 2017

                 Subject                                                 Grades I-V   Total Entries   % I - V
                 ACCOUNTING UNIT 1                                                                                              1719   2226   77%

                 ACCOUNTING UNIT 2                                                                                              1502   1876   80%
                 AGRICULTURAL SCIENCE UNIT 1                                                                                    266   335   79%

                 AGRICULTURAL SCIENCE UNIT 2                                                                                    106   132   80%
                 ANIMATION AND GAME DESIGN UNIT 1                                                                               88   100   88%

                 ANIMATION AND GAME DESIGN UNIT 2                                                                               2   2   100%
                 APPLIED MATHEMATICS UNIT 1                                                                                     629   720   87%

                 APPLIED MATHEMATICS UNIT 2                                                                                     363   434   84%
                 ART AND DESIGN UNIT 1                                                                                          215   237   91%

                 ART AND DESIGN UNIT 2                                                                                          241   248   97%
                 BIOLOGY UNIT 1                                                                                                 4957   5657   88%

                 BIOLOGY UNIT 2                                                                                                 3069   3356   91%
                 BUILDING AND MECHANICAL ENGINEERING DRAWING
                 UNIT 1 (MECH)                                                        234    282       83%
                 BUILDING AND MECHANICAL ENGINEERING DRAWING
                 UNIT 2 (BUILD)                                                       116    150       77%


                                                                                                         9