
Page 15 - paper-Dr. mohamed saad
P. 15
Journal of University of Shanghai for Science and Technology ISSN: 1007-6735
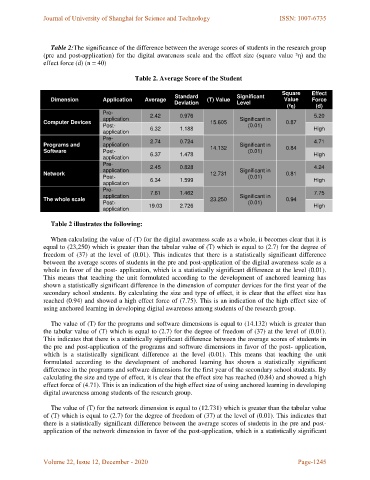
Table 2:The significance of the difference between the average scores of students in the research group
(pre and post-application) for the digital awareness scale and the effect size (square value ²η) and the
effect force (d) (n = 40)
Table 2. Average Score of the Student
Dimension Application Average Standard (T) Value Significant Square Effect
Computer Devices Deviation Level Value Force
Programs and Pre-
Software application 2.42 0.976 15.605 Significant in (²η) (d)
Network Post- 6.32 1.188 (0.01) 0.87 5.20
application
The whole scale Pre- 2.74 0.724 14.132 Significant in 0.84 High
application 6.37 1.478 (0.01)
Post- 0.81 4.71
application 2.45 0.828 12.731 Significant in
Pre- 6.34 1.599 (0.01) 0.94 High
application
Post- 7.61 1.462 23.250 Significant in 4.24
application 19.03 2.726 (0.01)
Pre- High
application
Post- 7.75
application
High
Table 2 illustrates the following:
When calculating the value of (T) for the digital awareness scale as a whole, it becomes clear that it is
equal to (23,250) which is greater than the tabular value of (T) which is equal to (2.7) for the degree of
freedom of (37) at the level of (0.01). This indicates that there is a statistically significant difference
between the average scores of students in the pre and post-application of the digital awareness scale as a
whole in favor of the post- application, which is a statistically significant difference at the level (0.01).
This means that teaching the unit formulated according to the development of anchored learning has
shown a statistically significant difference in the dimension of computer devices for the first year of the
secondary school students. By calculating the size and type of effect, it is clear that the effect size has
reached (0.94) and showed a high effect force of (7.75). This is an indication of the high effect size of
using anchored learning in developing digital awareness among students of the research group.
The value of (T) for the programs and software dimensions is equal to (14.132) which is greater than
the tabular value of (T) which is equal to (2.7) for the degree of freedom of (37) at the level of (0.01).
This indicates that there is a statistically significant difference between the average scores of students in
the pre and post-application of the programs and software dimensions in favor of the post- application,
which is a statistically significant difference at the level (0.01). This means that teaching the unit
formulated according to the development of anchored learning has shown a statistically significant
difference in the programs and software dimensions for the first year of the secondary school students. By
calculating the size and type of effect, it is clear that the effect size has reached (0.84) and showed a high
effect force of (4.71). This is an indication of the high effect size of using anchored learning in developing
digital awareness among students of the research group.
The value of (T) for the network dimension is equal to (12.731) which is greater than the tabular value
of (T) which is equal to (2.7) for the degree of freedom of (37) at the level of (0.01). This indicates that
there is a statistically significant difference between the average scores of students in the pre and post-
application of the network dimension in favor of the post-application, which is a statistically significant
Volume 22, Issue 12, December - 2020 Page-1245