
Page 10 - July Housing Market SE Michigan
P. 10
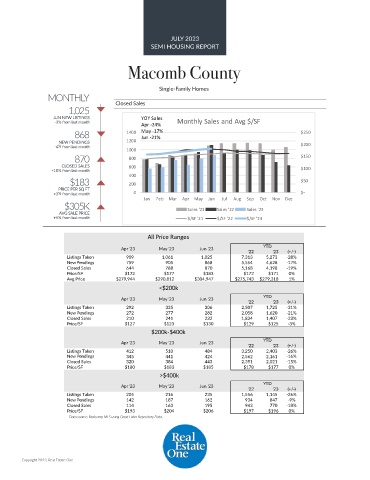
JULY 2023
                                                   SEMI HOUSING REPORT

                                           Macomb County


                                                      Single-Family Homes
                 MONTHLY
                        1,025          Closed Sales

                   JUN NEW LISTINGS             YOY Sales   Monthly Sales and Avg $/SF
                   -3% from last month          Apr -24%
                          868              1400 May -17%                                             $250
                                                Jun -21%
                    NEW PENDINGS           1200                                                      $200
                   -4% from last month
                                           1000
                          870               800                                                      $150
                     CLOSED SALES           600                                                      $100
                  +10% from last month      400
                        $183                200                                                      $50
                    PRICE PER SQ FT
                   +3% from last month       0                                                       $-
                                                 Jan  Feb  Mar  Apr  May  Jun  Jul  Aug  Sep  Oct  Nov  Dec
                      $305K
                     AVG SALE PRICE                            Sales '21  Sales '22  Sales '23
                   +5% from last month                         $/SF '21  $/SF '22  $/SF '23


                                                  All Price Ranges

                                         Apr '23      May '23      Jun '23              YTD
                                                                                   '22     '23  (+/-)
                       Listings Taken                    909                 1,061                 1,025            7,313            5,273  -28%
                       New Pendings                    759                    905                    868            5,554            4,628  -17%
                       Closed Sales                    644                    788                    870            5,168            4,198  -19%
                       Price/SF           $172         $177         $183          $172    $171   0%
                       Avg Price       $279,944     $290,812     $304,947      $275,743  $279,318  1%
                                                      <$200k

                                         Apr '23      May '23      Jun '23              YTD
                                                                                   '22     '23  (+/-)
                       Listings Taken                    292                    335                    306            2,507            1,725  -31%
                       New Pendings                    272                    277                    282            2,058            1,620  -21%
                       Closed Sales                    210                    241                    232            1,834            1,407  -23%
                       Price/SF           $127         $123         $130          $129    $125  -3%
                                                   $200k-$400k
                                         Apr '23      May '23      Jun '23              YTD
                                                                                   '22     '23  (+/-)
                       Listings Taken                    412                    510                    484            3,250            2,403  -26%
                       New Pendings                    345                    441                    424            2,562            2,161  -16%
                       Closed Sales                    320                    384                    443            2,391            2,021  -15%
                       Price/SF           $180         $183         $185          $178    $177   0%
                                                      >$400k
                                                                                        YTD
                                         Apr '23      May '23      Jun '23
                                                                                   '22     '23  (+/-)
                       Listings Taken                    205                    216                    235            1,556            1,145  -26%
                       New Pendings                    142                    187                    162               934               847  -9%
                       Closed Sales                    114                    163                    195               943               770  -18%
                       Price/SF           $193         $204         $206          $197    $196   0%
                        Data source: Realcomp MLS using Great Lakes Repository Data.


        Copyright 2023, Real Estate One