
Page 7 - July Housing Market SE Michigan
P. 7
JULY 2023
SEMI HOUSING REPORT
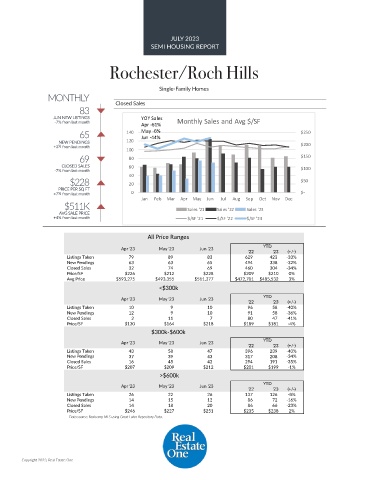
Rochester/Roch Hills
Single-Family Homes
MONTHLY
83 Closed Sales
JUN NEW LISTINGS YOY Sales Monthly Sales and Avg $/SF
-7% from last month Apr -61%
65 140 May -6% $250
Jun -44%
NEW PENDINGS 120 $200
+3% from last month
100
69 80 $150
CLOSED SALES 60 $100
-7% from last month 40
$228 20 $50
PRICE PER SQ FT
+7% from last month 0 $-
Jan Feb Mar Apr May Jun Jul Aug Sep Oct Nov Dec
$511K
AVG SALE PRICE Sales '21 Sales '22 Sales '23
+4% from last month $/SF '21 $/SF '22 $/SF '23
All Price Ranges
Apr '23 May '23 Jun '23 YTD
'22 '23 (+/-)
Listings Taken 79 89 83 629 423 -33%
New Pendings 63 63 65 494 338 -32%
Closed Sales 32 74 69 460 304 -34%
Price/SF $226 $212 $228 $209 $210 0%
Avg Price $593,275 $493,355 $511,377 $472,701 $485,532 3%
<$300k
Apr '23 May '23 Jun '23 YTD
'22 '23 (+/-)
Listings Taken 10 9 10 96 58 -40%
New Pendings 12 9 10 91 58 -36%
Closed Sales 2 11 7 80 47 -41%
Price/SF $130 $164 $218 $189 $181 -4%
$300k-$600k
Apr '23 May '23 Jun '23 YTD
'22 '23 (+/-)
Listings Taken 43 58 47 396 239 -40%
New Pendings 37 39 43 317 208 -34%
Closed Sales 16 45 42 294 191 -35%
Price/SF $207 $209 $212 $201 $199 -1%
>$600k
YTD
Apr '23 May '23 Jun '23
'22 '23 (+/-)
Listings Taken 26 22 26 137 126 -8%
New Pendings 14 15 12 86 72 -16%
Closed Sales 14 18 20 86 66 -23%
Price/SF $246 $227 $251 $235 $238 2%
Data source: Realcomp MLS using Great Lakes Repository Data.
Copyright 2023, Real Estate One