
Page 2 - July Housing Market SE Michigan
P. 2
JULY 2023
SEMI HOUSING REPORT
Supply Down, Demand Strong, Prices at Historic Highs
The Southeast Michigan real estate market continues to see historic trends as we move through the summer of 2023.
While inventory has dropped significantly, down 32% compared to June of 2022, strong demand remains unabated.
Despite depleted inventory quantity and quality, prices are at historic highs, just above former records from last year.
Despite the shortage of new listings, down by 33%, buyers are tenaciously active, with June and July showings down by
just 2% from last year—a testament to strong and stable demand.
The supply shortage is, however, creating friction in transaction activity. June new pendings and closed sales were down
12% and 17% compared to last year. That drop in sales activity is primarily due to the lack of quality inventory. The best
listings continue to sell immediately leaving shelves half-full with tired seconds.
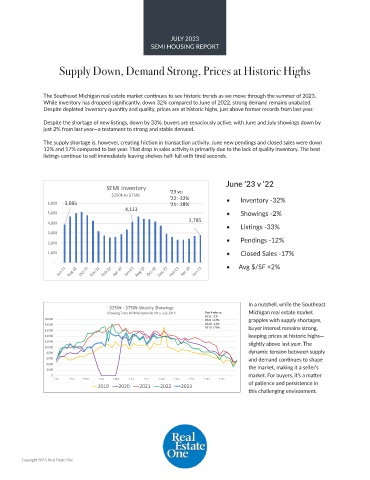
June ‘23 v ‘22
SEMI Inventory '23 vs:
$250k to $750k '22: -32%
6,000 3,885 '21: -28% • Inventory -32%
4,113
5,000 • Showings -2%
2,785
4,000
• Listings -33%
3,000
• Pendings -12%
2,000
1,000 • Closed Sales -17%
- • Avg $/SF +2%
Jun-21 Aug-21 Oct-21 Dec-21 Feb-22 Apr-22 Jun-22 Aug-22 Oct-22 Dec-22 Feb-23 Apr-23 Jun-23
In a nutshell, while the Southeast
$250k - $750k Weekly Showings
ShowingTime MI Marketwide thru July 24th Past 4 wks vs: Michigan real estate market
20000 2022: -2% grapples with supply shortages,
2021: -12%
18000 2020: -11%
2019: +20% buyer interest remains strong,
16000
14000 keeping prices at historic highs—
12000 slightly above last year. The
10000
8000 dynamic tension between supply
6000 and demand continues to shape
4000 the market, making it a seller’s
2000
0 market. For buyers, it’s a matter
2-Jan 2-Feb 2-Mar 2-Apr 2-May 2-Jun 2-Jul 2-Aug 2-Sep 2-Oct 2-Nov 2-Dec
2019 2020 2021 2022 2023 of patience and persistence in
this challenging environment.
Copyright 2023, Real Estate One