
Page 5 - July Housing Market SE Michigan
P. 5
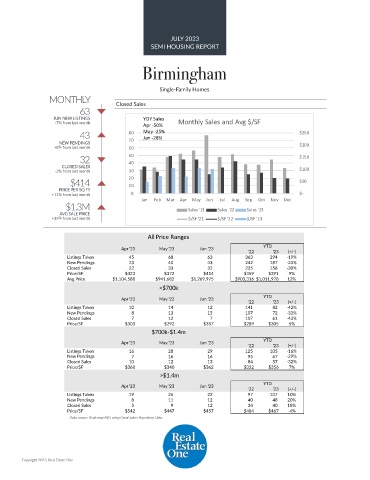
JULY 2023
                                                   SEMI HOUSING REPORT

                                                Birmingham


                                                      Single-Family Homes
                 MONTHLY               Closed Sales

                           63
                   JUN NEW LISTINGS             YOY Sales   Monthly Sales and Avg $/SF
                   -7% from last month          Apr -50%
                           43               80  May -25%                                             $250
                                                Jun -28%
                     NEW PENDINGS           70                                                       $200
                   +8% from last month      60
                           32               50                                                       $150
                      CLOSED SALES          40
                   -3% from last month      30                                                       $100
                        $414                20                                                       $50
                                            10
                    PRICE PER SQ FT
                  +11% from last month      0                                                        $-
                                                Jan  Feb  Mar  Apr  May  Jun  Jul  Aug  Sep  Oct  Nov  Dec
                       $1.3M
                     AVG SALE PRICE                            Sales '21  Sales '22  Sales '23
                  +35% from last month                         $/SF '21  $/SF '22  $/SF '23

                                                  All Price Ranges

                                         Apr '23      May '23      Jun '23              YTD
                                                                                   '22     '23  (+/-)
                       Listings Taken                       45                       68                       63               363               294  -19%
                       New Pendings                       23                       40                       43               242               187  -23%
                       Closed Sales                       22                       33                       32               225               158  -30%
                       Price/SF           $423         $372         $414          $359    $391   9%
                       Avg Price      $1,104,588    $941,682    $1,269,975     $903,316 $1,011,978  12%
                                                      <$700k

                                         Apr '23      May '23      Jun '23              YTD
                                                                                   '22     '23  (+/-)
                       Listings Taken                       10                       14                       12               141                  82  -42%
                       New Pendings                         8                       13                       15               107                  72  -33%
                       Closed Sales                         7                       12                         7               107                  61  -43%
                       Price/SF           $303         $292         $357          $289    $305   5%
                                                   $700k-$1.4m
                                         Apr '23      May '23      Jun '23              YTD
                                                                                   '22     '23  (+/-)
                       Listings Taken                       16                       28                       29               125               105  -16%
                       New Pendings                         7                       16                       16                 95                  67  -29%
                       Closed Sales                       10                       12                       13                 84                  57  -32%
                       Price/SF           $368         $340         $362          $332    $356   7%
                                                      >$1.4m
                                                                                        YTD
                                         Apr '23      May '23      Jun '23
                                                                                   '22     '23  (+/-)
                       Listings Taken                       19                       26                       22                 97               107  10%
                       New Pendings                         8                       11                       12                 40                  48  20%
                       Closed Sales                         5                         9                       12                 34                  40  18%
                       Price/SF           $542         $447         $457          $484    $467  -4%
                        Data source: Realcomp MLS using Great Lakes Repository Data.


        Copyright 2023, Real Estate One