
Page 9 - science
P. 9
I have Ask the students in your class
found that ... about their favourite colour.
Design a table for your results.
Scientists write down or record Record the results in your table.
what they have found from their Charts
observations and measurements. Results from tables can be shown
This helps them to see patterns or as charts or graphs.
to sort things into groups.
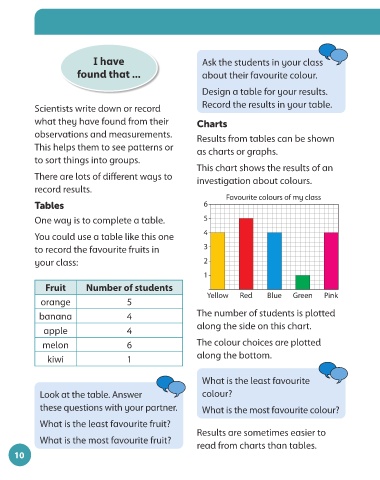
This chart shows the results of an
There are lots of different ways to investigation about colours.
record results.
Favourite colours of my class
Tables 6
One way is to complete a table. 5
You could use a table like this one 4
to record the favourite fruits in 3
your class: 2
1
Fruit Number of students
Yellow Red Blue Green Pink
orange 5
banana 4 The number of students is plotted
apple 4 along the side on this chart.
melon 6 The colour choices are plotted
kiwi 1 along the bottom.
What is the least favourite
Look at the table. Answer colour?
these questions with your partner. What is the most favourite colour?
What is the least favourite fruit?
Results are sometimes easier to
What is the most favourite fruit?
read from charts than tables.
10