
Page 101 - DUOKOPT BIBLIOBOOK
P. 101
EFFICACY
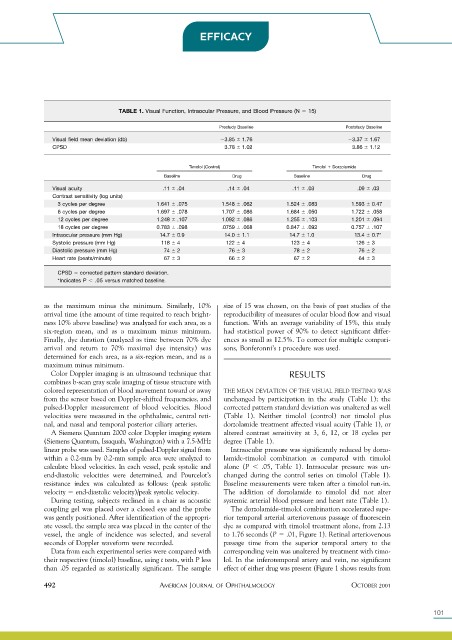
TABLE 1. Visual Function, Intraocular Pressure, and Blood Pressure (N 15)
Prestudy Baseline Poststudy Baseline
Visual field mean deviation (db) 3.85 1.76 3.37 1.67
CPSD 3.78 1.02 3.86 1.12
Timolol (Control) Timolol Dorzolamide
Baseline Drug Baseline Drug
Visual acuity .11 .04 .14 .04 .11 .03 .09 .03
Contrast sensitivity (log units)
3 cycles per degree 1.641 .075 1.548 .062 1.524 .083 1.593 0.47
6 cycles per degree 1.697 .078 1.707 .086 1.684 .050 1.722 .058
12 cycles per degree 1.248 .107 1.092 .086 1.255 .103 1.201 .094
18 cycles per degree 0.783 .098 .0759 .068 0.847 .092 0.757 .107
Intraocular pressure (mm Hg) 14.7 0.9 14.0 1.1 14.7 1.0 13.4 0.7*
Systolic pressure (mm Hg) 118 4 122 4 123 4 126 3
Diastolic pressure (mm Hg) 74 2 76 3 78 2 76 2
Heart rate (beats/minute) 67 3 66 2 67 2 64 3
CPSD corrected pattern standard deviation.
*Indicates P .05 versus matched baseline.
as the maximum minus the minimum. Similarly, 10% size of 15 was chosen, on the basis of past studies of the
arrival time (the amount of time required to reach bright- reproducibility of measures of ocular blood flow and visual
ness 10% above baseline) was analyzed for each area, as a function. With an average variability of 15%, this study
six-region mean, and as a maximum minus minimum. had statistical power of 90% to detect significant differ-
Finally, dye duration (analyzed as time between 70% dye ences as small as 12.5%. To correct for multiple compari-
arrival and return to 70% maximal dye intensity) was sons, Bonferonni’s t procedure was used.
determined for each area, as a six-region mean, and as a
maximum minus minimum.
Color Doppler imaging is an ultrasound technique that RESULTS
combines b-scan gray scale imaging of tissue structure with
colored representation of blood movement toward or away THE MEAN DEVIATION OF THE VISUAL FIELD TESTING WAS
from the sensor based on Doppler-shifted frequencies, and unchanged by participation in the study (Table 1); the
pulsed-Doppler measurement of blood velocities. Blood corrected pattern standard deviation was unaltered as well
velocities were measured in the ophthalmic, central reti- (Table 1). Neither timolol (control) nor timolol plus
nal, and nasal and temporal posterior ciliary arteries. dorzolamide treatment affected visual acuity (Table 1), or
A Siemens Quantum 2000 color Doppler imaging system altered contrast sensitivity at 3, 6, 12, or 18 cycles per
(Siemens Quantum, Issaquah, Washington) with a 7.5-MHz degree (Table 1).
linear probe was used. Samples of pulsed-Doppler signal from Intraocular pressure was significantly reduced by dorzo-
within a 0.2-mm by 0.2-mm sample area were analyzed to lamide-timolol combination as compared with timolol
calculate blood velocities. In each vessel, peak systolic and alone (P .05, Table 1). Intraocular pressure was un-
end-diastolic velocities were determined, and Pourcelot’s changed during the control series on timolol (Table 1).
resistance index was calculated as follows: (peak systolic Baseline measurements were taken after a timolol run-in.
velocity end-diastolic velocity)/peak systolic velocity. The addition of dorzolamide to timolol did not alter
During testing, subjects reclined in a chair as acoustic systemic arterial blood pressure and heart rate (Table 1).
coupling gel was placed over a closed eye and the probe The dorzolamide-timolol combination accelerated supe-
was gently positioned. After identification of the appropri- rior temporal arterial arteriovenous passage of fluorescein
ate vessel, the sample area was placed in the center of the dye as compared with timolol treatment alone, from 2.13
vessel, the angle of incidence was selected, and several to 1.76 seconds (P .01, Figure 1). Retinal arteriovenous
seconds of Doppler waveform were recorded. passage time from the superior temporal artery to the
Data from each experimental series were compared with corresponding vein was unaltered by treatment with timo-
their respective (timolol) baseline, using t tests, with P less lol. In the inferotemporal artery and vein, no significant
than .05 regarded as statistically significant. The sample effect of either drug was present (Figure 1 shows results from
492 AMERICAN JOURNAL OF OPHTHALMOLOGY OCTOBER 2001
101