
Page 20 - Bilancio sostenibilita Ratti
P. 20
CAP. 2 | LA PASSIONE DEL SAPER FARE
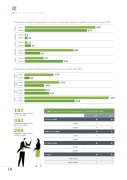
Popolazione aziendale del Gruppo Ratti con contratto a tempo indeterminato per quali ca e genere al 31 dicembre 2017
Donne Uomini
2
Donne Uomini
Donne Uomini
Donne Uomini
293
257
Donne Uomini
10 11
25
64
202
78
158
Popolazione aziendale del Gruppo Ratti per fascia d’età e genere al 31 dicembre 2017
Donne Uomini
159
28
Donne
Uomini 108
194
Donne Uomini
Donne Uomini
187
DIPENDENTI GRUPPO RATTI SOTTO I 30 ANNI
302
DIPENDENTI GRUPPO RATTI TRA I 30 E 50 ANNI
266
DIPENDENTI GRUPPO RATTI SOPRA I 50 ANNI
119 147
283
Donne Uomini
Donne Uomini
Donne Uomini
472
0 0
2 1
1 5
TAB 3 - Composizione del C.d.A .per genere e età al 31 dicembre 2017
2016
2017
SOTTO I 30 ANNI
OLTRE I 50 ANNI
0
0
0
0
TRAI30EI50ANNI
3
3
2
1
6
6
1
5
TOTALE
9
9
Totale Donne
3
3
Totale Uomini
6
6
18
TOTALE OVER COMPRESO UNDER 50 30-50 30
OPERAI IMPIEGATI QUADRI DIRIGENTI TOTALE
