
Page 37 - Geologic Investigations in the Lake Valley Area, Sierra County, New Mexico
P. 37
Stitched 1-D Model Section–Mod1dXY Res
lv100
111
112
117
114
116
118
119
120
121
122
124
0
100
200
A
SW
0
500
1000
114
1500
2000
119
2500
120
3000 METERS
NE
124
Ohm-m
3.16 4.47 6.31 8.91 12.6 17.8 25.1 35.5 50.1 70.8 100 141 200 282 398
N 45 E lv100
Ohm-m
3.16
4.47 6.31 8.91 12.6 17.8 25.1 35.5 50.1 70.8 100 141 200 282 398
N 45 E
A
U
B
FAULT ZONE
Stitched 1-D Model Section–Mod1dXY Res
111
112
117
116
118
121
122
U
FAULT ZONE
B
V
C
C
C
0
1000
2000
B
SW
0
500
1000
1500
2000
2500
3000 METERS
NE
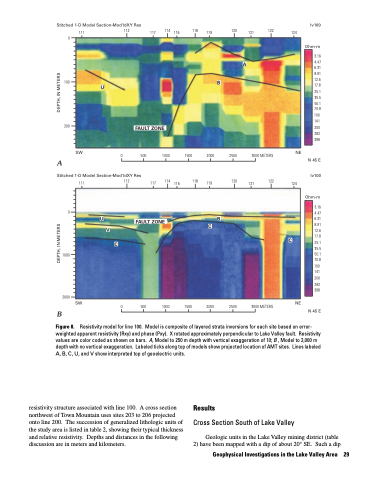
Figure 8.
Resistivity model for line 100. Model is composite of layered strata inversions for each site based on error- weighted apparent resistivity (Rxy) and phase (Pxy). X rotated approximately perpendicular to Lake Valley fault. Resistivity values are color coded as shown on bars. A, Model to 250 m depth with vertical exaggeration of 10; B , Model to 2,000 m depth with no vertical exaggeration. Labeled ticks along top of models show projected location of AMT sites. Lines labeled A, B, C, U, and V show interpreted top of geoelectric units.
resistivity structure associated with line 100. A cross section northwest of Town Mountain uses sites 203 to 206 projected onto line 200. The succession of generalized lithologic units of the study area is listed in table 2, showing their typical thickness and relative resistivity. Depths and distances in the following discussion are in meters and kilometers.
Results
Cross Section South of Lake Valley
Geologic units in the Lake Valley mining district (table 2) have been mapped with a dip of about 20° SE. Such a dip
Geophysical Investigations in the Lake Valley Area 29
DEPTH, IN METERS DEPTH, IN METERS
