
Page 39 - Geologic Investigations in the Lake Valley Area, Sierra County, New Mexico
P. 39
Stitched 1-D Model Section–Mod1dXY Res
lv300
124
325
326
0
100
200
300
400
500
600
700
800
900
1000
1100
1200
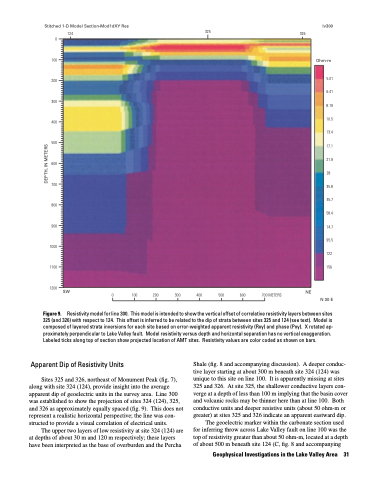
Figure 9.
Apparent Dip of Resistivity Units
Sites 325 and 326, northeast of Monument Peak (fig. 7), along with site 324 (124), provide insight into the average apparent dip of geoelectric units in the survey area. Line 300 was established to show the projection of sites 324 (124), 325, and 326 as approximately equally spaced (fig. 9). This does not represent a realistic horizontal perspective; the line was con- structed to provide a visual correlation of electrical units.
The upper two layers of low resistivity at site 324 (124) are at depths of about 30 m and 120 m respectively; these layers have been interpreted as the base of overburden and the Percha
Ohm-m
5.01 6.41 8.19 10.5 13.4 17.1 21.9 28 35.8 45.7 58.4 74.7 95.5 122 156
N 30 E
SW
0
100
200
300
400
500
600
700 METERS
NE
Resistivity model for line 300. This model is intended to show the vertical offset of correlative resistivity layers between sites 325 (and 326) with respect to 124. This offset is inferred to be related to the dip of strata between sites 325 and 124 (see text). Model is composed of layered strata inversions for each site based on error-weighted apparent resistivity (Rxy) and phase (Pxy). X rotated ap proximately perpendicular to Lake Valley fault. Model resistivity versus depth and horizontal separation has no vertical exaggeration. Labeled ticks along top of section show projected location of AMT sites. Resistivity values are color coded as shown on bars.
Shale (fig. 8 and accompanying discussion). A deeper conduc tive layer starting at about 300 m beneath site 324 (124) was unique to this site on line 100. It is apparently missing at sites 325 and 326. At site 325, the shallower conductive layers con- verge at a depth of less than 100 m implying that the basin cover and volcanic rocks may be thinner here than at line 100. Both conductive units and deeper resistive units (about 50 ohm-m or greater) at sites 325 and 326 indicate an apparent eastward dip.
The geoelectric marker within the carbonate section used for inferring throw across Lake Valley fault on line 100 was the top of resistivity greater than about 50 ohm-m, located at a depth of about 500 m beneath site 124 (C, fig. 8 and accompanying
Geophysical Investigations in the Lake Valley Area 31
DEPTH, IN METERS
