
Page 11 - Gastric pentadecapeptide BPC 157
P. 11
117
until 180 degrees. Three-dimensional reconstructions of the Effect of BPC 157 on gingival inflammation in experimental
images were visualized using the NRecon software (SkyScan, periodontitis
Kontich, Belgium) with 0% beam hardening and 10% ring
artefact correction. Global thresholding was performed by an Next we studied the effect of BPC 157 on gingival
experienced operator. Image datasets were analysed by the CT inflammation in experimental periodontitis. A ligature was
Analyser software (1.7.0.5, SkyScan, Kontich, Belgium) to placed around the cervix of the lower left first molar as described
evaluate bone volume (BV). Alveolar bone morphometric in Materials and Methods in 36 rats to induce unilateral
parameters were investigated between mesial and distal roots of periodontitis. Rats were then divided into three groups with 12
the lower first molars, at half way of the root length (Fig. 5C). animals each. Animals received BPC 157 once daily for 12 days
Alveolar bone resorption was estimated by calculating the at 100 ng/kg body weight or at 10 µg/kg body weight in the low-
distance between the cemento-enameljunction (CEJ) and the dose and in the high-dose group, respectively, whereas the
crista alveolaris around the mandibular first molars (Fig. 4B). control group received physiological saline i.p. once daily for 12
Distances at mesial, buccal, mesiolingual and lingual positions days. Nine rats were randomly chosen from each group for
were measured and expressed in mm (Fig. 4A). Alveolar bone gingival tissue vascular permeability measurements, whereas the
resorption was also calculated under the furcation area. The remaining animals were used for soft tissue histology.
distance between the furcation of the root and the surface of the In ligature induced experimental periodontitis, the increase
interradicular bone at the same axis was given in mm (Fig. 5A). in vascular permeability in the gingival tissue proximal to the
This measurement was taken on resliced mandibular cross ligature is proportional to the extent of local inflammation. The
section images at the midradicular plain of the lingual root. increased vascular permeability can be detected by measuring
the extravasation of Evans blue dye. From nine rats of each
Statistical analysis group, gingivomucosal tissue samples were collected from both
the ligature and the non-ligature contralateral sides and vascular
Data are presented as mean±SEM. Statistical analysis was permeability was measured as described in Materials and
performed by repeated measurement of ANOVA and Bonferroni Methods. We compared the vascular permeability on the non-
post hoc test and/or contrast analysis of compared groups. Paired ligature side and on the ligature side in each of the three groups.
(in group) and unpaired (between groups) Student t-test were There was no significant difference among the three groups in
used in microCT analysis. p<0.05 was considered statistically the vascular permeabilities on the non-ligature (contralateral)
significant. sides. In the saline treated group, vascular permeability
increased in response to ligature compared to the contralateral
RESULTS side (29.8±2.5 vs. 10.8±1.4 µg Evans blue/g tissue, respectively,
p<0.05, Fig. 2). Vascular permeabilty also increased in response
Acute effect of BPC 157 on gingival blood flow to ligature in the low-dose BPC 157 group (24.9±5.5 vs.
10.9±1.4 µg Evans blue/g tissue, respectively, p<0.05, Fig. 2).
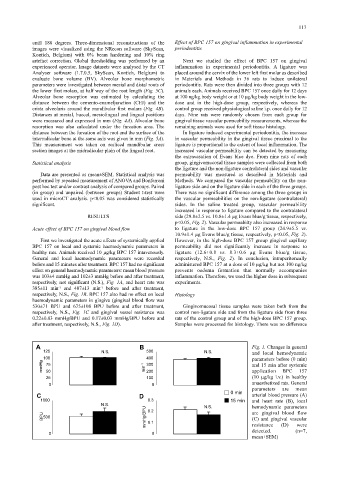
First we investigated the acute effects of systemically applied However, in the high-dose BPC 157 group gingival capillary
BPC 157 on local and systemic haemodynamic parameters in permeability did not significantly increase in response to
healthy rats. Animals received 10 µg/kg BPC 157 intavenously. ligature (12.6±0.8 vs. 8.3±0.6 µg Evans blue/g tissue,
General and local haemodynamic parameters were recorded respectively, N.S., Fig. 2). In conclusion, intraperitoneally
before and 15 minutes after treatment. BPC 157 had no significant administered BPC 157 at a dose of 10 µg/kg but not 100 ng/kg
effect on general haemodynamic parameters: mean blood pressure prevents oedema formation that normally accompanies
was 103±4 mmHg and 102±3 mmHg before and after treatment, inflammation. Therefore, we used the higher dose in subsequent
respectively, not significant (N.S.), Fig. 1A, and heart rate was experiments.
385±11 min -1 and 407±13 min -1 before and after treatment,
respectively, N.S., Fig. 1B. BPC 157 also had no effect on local Histology
haemodynamic parameters in gingiva (gingival blood flow was
530±71 BPU and 675±108 BPU before and after treatment, Gingivomucosal tissue samples were taken both from the
respectively, N.S., Fig. 1C and gingival vessel resistance was control non-ligature side and from the ligature side from three
0.22±0.03 mmHg/BPU and 0.17±0.03 mmHg/BPU before and rats of the control group and of the high-dose BPC 157 group.
after treatment, respectively, N.S., Fig. 1D). Samples were processed for histology. There was no difference
A B Fig. 1. Changes in general
125 N.S. 500 N.S. and local hemodynamic
100 400 parameters before (0 min)
mmHg 75 min -1 300 and 15 min after systemic
BPC
application
157
50
200
25 100 (10 µg/kg i.v.) in healthy
anaesthetized rats. General
0 0
parameters are mean
0 min
C D arterial blood pressure (A)
1000 0.3 15 min and heart rate (B), local
N.S. N.S. hemodynamic parameters
mmHg/BPU 0.1 (C) and gingival vascular
BPU 500 0.2 are gingival blood flow
were
resistance
detected. (D) (n=7,
0 0
mean±SEM)