Page 47 - C:\Users\Chris Patches\My ShareSync\Virtual Events\2024 - TMT Consumer\Book\Flip Output\
P. 47

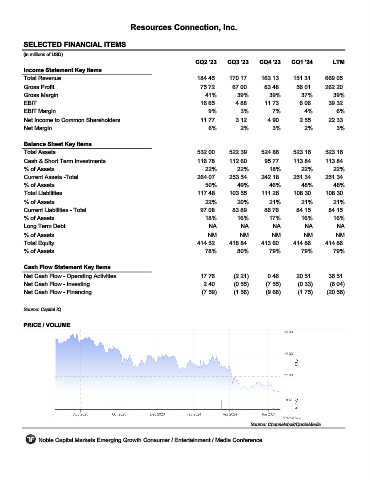
Resources Connection, Inc.


         SELECTED FINANCIAL ITEMS                                 RGP
         (in millions of USD)
                                                                     CQ2 '23    CQ3 '23    CQ4 '23    CQ1 '24       LTM
         Income Statement Key Items
         Total Revenue                                               184.45     170.17     163.13      151.31     669.05
         Gross Profit                                                 75.72      67.00       63.48      56.01     262.20
         Gross Margin                                                   41%        39%        39%        37%        39%
         EBIT                                                         16.65        4.88      11.73       6.06      39.32
         EBIT Margin                                                     9%         3%         7%         4%          6%
         Net Income to Common Shareholders                            11.77        3.12       4.90       2.55      22.33
         Net Margin                                                      6%         2%         3%          2%         3%

         Balance Sheet Key Items
         Total Assets                                                532.00     522.39     524.86      523.16     523.16
         Cash & Short Term Investments                               116.78     112.60       95.77     113.84     113.84
         % of Assets                                                    22%        22%        18%        22%         22%
         Current Assets -Total                                       264.07     253.54      242.18     251.34     251.34
         % of Assets                                                    50%        49%        46%        48%         48%
         Total Liabilities                                           117.48     103.55      111.26     108.30     108.30
         % of Assets                                                    22%        20%        21%        21%         21%
         Current Liabilities - Total                                  97.08      83.89       86.76      84.15      84.15
         % of Assets                                                    18%        16%        17%        16%        16%
         Long Term Debt                                                  NA         NA         NA          NA         NA
         % of Assets                                                     NM         NM         NM         NM         NM
         Total Equity                                                414.52     418.84     413.60      414.86     414.86
         % of Assets                                                    78%        80%        79%        79%        79%

         Cash Flow Statement Key Items
         Net Cash Flow - Operating Activities                         17.76       (2.21)      0.46      20.51      36.51
         Net Cash Flow - Investing                                     2.40       (0.55)     (7.55)     (0.33)     (6.04)
         Net Cash Flow - Financing                                     (7.59)     (1.56)     (9.68)     (1.75)    (20.56)

         Source: Capital IQ


         PRICE / VOLUME


                                                                                        Source: Channelchek/QuoteMedia

              Noble Capital Markets Emerging Growth Consumer / Entertainment / Media Conference
   42   43   44   45   46   47   48   49   50   51   52