Page 51 - C:\Users\Chris Patches\My ShareSync\Virtual Events\2024 - TMT Consumer\Book\Flip Output\
P. 51

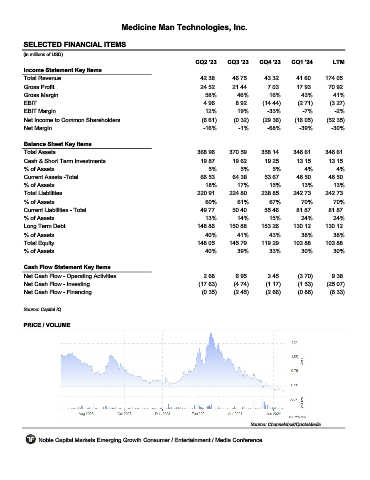
Medicine Man Technologies, Inc.


         SELECTED FINANCIAL ITEMS                                 SHWZ
         (in millions of USD)
                                                                     CQ2 '23    CQ3 '23    CQ4 '23    CQ1 '24       LTM
         Income Statement Key Items
         Total Revenue                                                42.38      46.75       43.32      41.60     174.05
         Gross Profit                                                 24.52      21.44        7.03      17.93      70.92
         Gross Margin                                                   58%        46%        16%        43%        41%
         EBIT                                                          4.96        8.92     (14.44)     (2.71)     (3.27)
         EBIT Margin                                                    12%        19%        -33%        -7%        -2%
         Net Income to Common Shareholders                             (6.61)     (0.32)    (29.36)    (16.05)    (52.35)
         Net Margin                                                    -16%         -1%       -68%       -39%       -30%

         Balance Sheet Key Items
         Total Assets                                                368.96     370.59     358.14      346.61     346.61
         Cash & Short Term Investments                                19.87      19.62       19.25      13.15      13.15
         % of Assets                                                     5%         5%         5%          4%         4%
         Current Assets -Total                                        66.53      64.38       53.67      46.50      46.50
         % of Assets                                                    18%        17%        15%        13%         13%
         Total Liabilities                                           220.91     224.80      238.85     242.73     242.73
         % of Assets                                                    60%        61%        67%        70%         70%
         Current Liabilities - Total                                  49.77      50.40       55.46      81.87      81.87
         % of Assets                                                    13%        14%        15%        24%        24%
         Long Term Debt                                              148.86     150.88     153.26      130.12     130.12
         % of Assets                                                    40%        41%        43%        38%        38%
         Total Equity                                                148.05     145.79     119.29      103.88     103.88
         % of Assets                                                    40%        39%        33%        30%        30%

         Cash Flow Statement Key Items
         Net Cash Flow - Operating Activities                          2.68        6.95       3.45      (3.70)      9.38
         Net Cash Flow - Investing                                    (17.63)     (4.74)     (1.17)     (1.53)    (25.07)
         Net Cash Flow - Financing                                     (0.35)     (2.45)     (2.66)     (0.86)     (6.33)

         Source: Capital IQ


         PRICE / VOLUME


                                                                                        Source: Channelchek/QuoteMedia

              Noble Capital Markets Emerging Growth Consumer / Entertainment / Media Conference
   46   47   48   49   50   51   52   53   54   55   56