
Page 49 - C:\Users\Chris Patches\My ShareSync\Virtual Events\2024 - TMT Consumer\Book\Flip Output\
P. 49
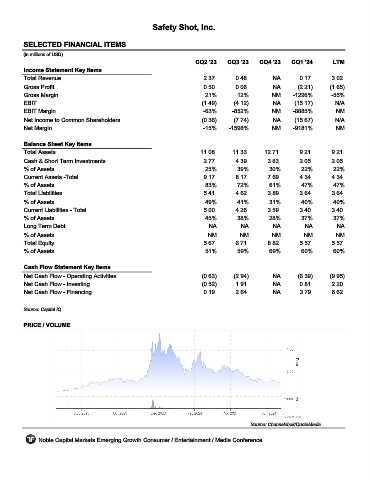
Safety Shot, Inc.


         SELECTED FINANCIAL ITEMS                                 SHOT
         (in millions of USD)
                                                                     CQ2 '23    CQ3 '23    CQ4 '23    CQ1 '24       LTM
         Income Statement Key Items
         Total Revenue                                                 2.37        0.48        NA        0.17       3.02
         Gross Profit                                                  0.50        0.06        NA       (2.21)     (1.65)
         Gross Margin                                                   21%        12%         NM     -1296%        -55%
         EBIT                                                          (1.49)     (4.12)       NA      (15.17)       N/A
         EBIT Margin                                                   -63%      -852%         NM     -8885%         NM
         Net Income to Common Shareholders                             (0.36)     (7.74)       NA      (15.67)       N/A
         Net Margin                                                    -15%     -1598%         NM     -9181%         NM

         Balance Sheet Key Items
         Total Assets                                                 11.08      11.33       12.71       9.21       9.21
         Cash & Short Term Investments                                 2.77        4.39       3.83       2.05       2.05
         % of Assets                                                    25%        39%        30%        22%        22%
         Current Assets -Total                                         9.17        8.17       7.69       4.34       4.34
         % of Assets                                                    83%        72%        61%        47%        47%
         Total Liabilities                                             5.41        4.62       3.89       3.64       3.64
         % of Assets                                                    49%        41%        31%        40%        40%
         Current Liabilities - Total                                   5.00        4.26       3.59       3.40       3.40
         % of Assets                                                    45%        38%        28%        37%        37%
         Long Term Debt                                                  NA         NA         NA          NA         NA
         % of Assets                                                     NM         NM         NM         NM         NM
         Total Equity                                                  5.67        6.71       8.82       5.57       5.57
         % of Assets                                                    51%        59%        69%        60%        60%

         Cash Flow Statement Key Items
         Net Cash Flow - Operating Activities                          (0.63)     (2.94)       NA       (6.39)     (9.95)
         Net Cash Flow - Investing                                     (0.52)      1.91        NA        0.81       2.20
         Net Cash Flow - Financing                                     0.19        2.64        NA        3.79       6.62

         Source: Capital IQ


         PRICE / VOLUME


                                                                                        Source: Channelchek/QuoteMedia

              Noble Capital Markets Emerging Growth Consumer / Entertainment / Media Conference