Page 105 - NobleCon21
P. 105

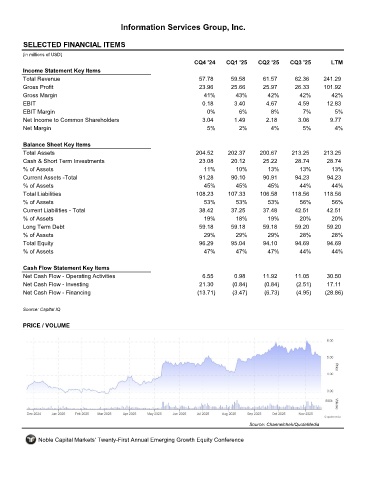
Information Services Group, Inc.


         SELECTED FINANCIAL ITEMS                                 III
         (in millions of USD)
                                                                     CQ4 '24    CQ1 '25    CQ2 '25    CQ3 '25       LTM
         Income Statement Key Items
         Total Revenue                                                57.78      59.58       61.57      62.36     241.29
         Gross Profit                                                 23.96      25.66       25.97      26.33     101.92
         Gross Margin                                                   41%        43%        42%        42%        42%
         EBIT                                                          0.18        3.40       4.67       4.59      12.83
         EBIT Margin                                                     0%         6%         8%         7%          5%
         Net Income to Common Shareholders                             3.04        1.49       2.18       3.06       9.77
         Net Margin                                                      5%         2%         4%         5%          4%

         Balance Sheet Key Items
         Total Assets                                                204.52     202.37     200.67      213.25     213.25
         Cash & Short Term Investments                                23.08      20.12       25.22      28.74      28.74
         % of Assets                                                    11%        10%        13%        13%         13%
         Current Assets -Total                                        91.28       90.10      90.91      94.23      94.23
         % of Assets                                                    45%        45%        45%        44%         44%
         Total Liabilities                                           108.23     107.33      106.58     118.56     118.56
         % of Assets                                                    53%        53%        53%        56%         56%
         Current Liabilities - Total                                  38.42      37.25       37.48      42.51      42.51
         % of Assets                                                    19%        18%        19%        20%        20%
         Long Term Debt                                               59.18      59.18       59.18      59.20      59.20
         % of Assets                                                    29%        29%        29%        28%        28%
         Total Equity                                                 96.29      95.04       94.10      94.69      94.69
         % of Assets                                                    47%        47%        47%        44%        44%

         Cash Flow Statement Key Items
         Net Cash Flow - Operating Activities                          6.55        0.98      11.92      11.05      30.50
         Net Cash Flow - Investing                                    21.30       (0.84)     (0.84)     (2.51)     17.11
         Net Cash Flow - Financing                                    (13.71)     (3.47)     (6.73)     (4.95)    (28.86)

         Source: Capital IQ


         PRICE / VOLUME


                                                                                        Source: Channelchek/QuoteMedia

              Noble Capital Markets' Twenty-First Annual Emerging Growth Equity Conference
   100   101   102   103   104   105   106   107   108   109   110