Page 101 - NobleCon21
P. 101

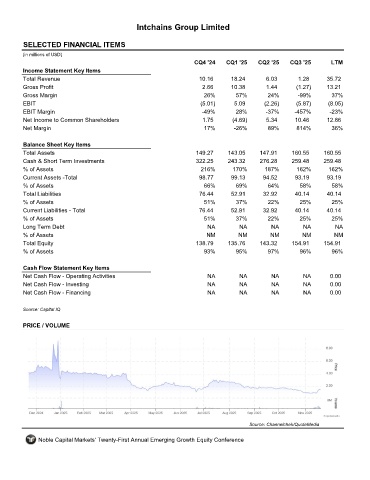
Intchains Group Limited


         SELECTED FINANCIAL ITEMS                                 ICG
         (in millions of USD)
                                                                     CQ4 '24    CQ1 '25    CQ2 '25    CQ3 '25       LTM
         Income Statement Key Items
         Total Revenue                                                10.16      18.24        6.03       1.28      35.72
         Gross Profit                                                  2.66      10.38        1.44      (1.27)     13.21
         Gross Margin                                                   26%        57%        24%        -99%       37%
         EBIT                                                          (5.01)      5.09      (2.26)     (5.87)     (8.05)
         EBIT Margin                                                   -49%        28%        -37%      -457%       -23%
         Net Income to Common Shareholders                             1.75       (4.69)      5.34      10.46      12.86
         Net Margin                                                     17%       -26%        89%       814%        36%

         Balance Sheet Key Items
         Total Assets                                                149.27     143.05     147.91      160.55     160.55
         Cash & Short Term Investments                               322.25     243.32     276.28      259.48     259.48
         % of Assets                                                   216%       170%       187%       162%       162%
         Current Assets -Total                                        98.77      99.13       94.52      93.19      93.19
         % of Assets                                                    66%        69%        64%        58%         58%
         Total Liabilities                                            76.44       52.91      32.92      40.14      40.14
         % of Assets                                                    51%        37%        22%        25%         25%
         Current Liabilities - Total                                  76.44      52.91       32.92      40.14      40.14
         % of Assets                                                    51%        37%        22%        25%        25%
         Long Term Debt                                                  NA         NA         NA          NA         NA
         % of Assets                                                     NM         NM         NM         NM         NM
         Total Equity                                                138.79     135.76     143.32      154.91     154.91
         % of Assets                                                    93%        95%        97%        96%        96%

         Cash Flow Statement Key Items
         Net Cash Flow - Operating Activities                            NA         NA         NA          NA       0.00
         Net Cash Flow - Investing                                       NA         NA         NA          NA       0.00
         Net Cash Flow - Financing                                       NA         NA         NA          NA       0.00

         Source: Capital IQ


         PRICE / VOLUME


                                                                                        Source: Channelchek/QuoteMedia

              Noble Capital Markets' Twenty-First Annual Emerging Growth Equity Conference
   96   97   98   99   100   101   102   103   104   105   106