
Page 99 - NobleCon21
P. 99
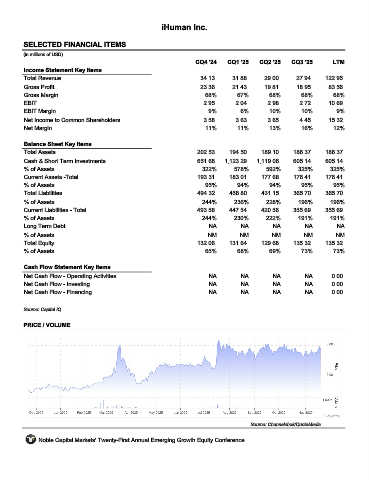
iHuman Inc.


         SELECTED FINANCIAL ITEMS                                 IH
         (in millions of USD)
                                                                     CQ4 '24    CQ1 '25    CQ2 '25    CQ3 '25       LTM
         Income Statement Key Items
         Total Revenue                                                34.13      31.88       29.00      27.94     122.95
         Gross Profit                                                 23.36      21.43       19.81      18.95      83.56
         Gross Margin                                                   68%        67%        68%        68%        68%
         EBIT                                                          2.95        2.04       2.98       2.72      10.69
         EBIT Margin                                                     9%         6%        10%        10%          9%
         Net Income to Common Shareholders                             3.58        3.63       3.65       4.45      15.32
         Net Margin                                                     11%        11%        13%        16%         12%

         Balance Sheet Key Items
         Total Assets                                                202.53     194.50     189.10      186.37     186.37
         Cash & Short Term Investments                               651.68    1,123.29   1,119.06     605.14     605.14
         % of Assets                                                   322%       578%       592%       325%       325%
         Current Assets -Total                                       193.31     183.01      177.68     176.41     176.41
         % of Assets                                                    95%        94%        94%        95%         95%
         Total Liabilities                                           494.32     458.80      431.15     365.70     365.70
         % of Assets                                                   244%       236%       228%       196%       196%
         Current Liabilities - Total                                 493.58     447.54     420.56      355.69     355.69
         % of Assets                                                   244%       230%       222%       191%       191%
         Long Term Debt                                                  NA         NA         NA          NA         NA
         % of Assets                                                     NM         NM         NM         NM         NM
         Total Equity                                                132.06     131.64     129.68      135.32     135.32
         % of Assets                                                    65%        68%        69%        73%        73%

         Cash Flow Statement Key Items
         Net Cash Flow - Operating Activities                            NA         NA         NA          NA       0.00
         Net Cash Flow - Investing                                       NA         NA         NA          NA       0.00
         Net Cash Flow - Financing                                       NA         NA         NA          NA       0.00

         Source: Capital IQ


         PRICE / VOLUME


                                                                                        Source: Channelchek/QuoteMedia

              Noble Capital Markets' Twenty-First Annual Emerging Growth Equity Conference