Page 103 - NobleCon21
P. 103

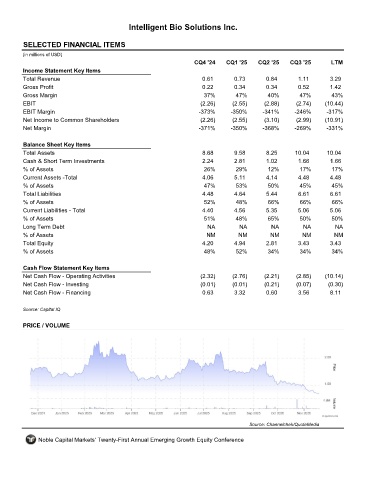
Intelligent Bio Solutions Inc.


         SELECTED FINANCIAL ITEMS                                 INBS
         (in millions of USD)
                                                                     CQ4 '24    CQ1 '25    CQ2 '25    CQ3 '25       LTM
         Income Statement Key Items
         Total Revenue                                                 0.61        0.73       0.84       1.11       3.29
         Gross Profit                                                  0.22        0.34       0.34       0.52       1.42
         Gross Margin                                                   37%        47%        40%        47%        43%
         EBIT                                                          (2.26)     (2.55)     (2.88)     (2.74)    (10.44)
         EBIT Margin                                                  -373%      -350%      -341%       -246%      -317%
         Net Income to Common Shareholders                             (2.26)     (2.55)     (3.10)     (2.99)    (10.91)
         Net Margin                                                   -371%      -350%      -368%       -269%      -331%

         Balance Sheet Key Items
         Total Assets                                                  8.68        9.58       8.25      10.04      10.04
         Cash & Short Term Investments                                 2.24        2.81       1.02       1.66       1.66
         % of Assets                                                    26%        29%        12%        17%         17%
         Current Assets -Total                                         4.06        5.11       4.14       4.48       4.48
         % of Assets                                                    47%        53%        50%        45%         45%
         Total Liabilities                                             4.48        4.64       5.44       6.61       6.61
         % of Assets                                                    52%        48%        66%        66%         66%
         Current Liabilities - Total                                   4.40        4.56       5.35       5.06       5.06
         % of Assets                                                    51%        48%        65%        50%        50%
         Long Term Debt                                                  NA         NA         NA          NA         NA
         % of Assets                                                     NM         NM         NM         NM         NM
         Total Equity                                                  4.20        4.94       2.81       3.43       3.43
         % of Assets                                                    48%        52%        34%        34%        34%

         Cash Flow Statement Key Items
         Net Cash Flow - Operating Activities                          (2.32)     (2.76)     (2.21)     (2.85)    (10.14)
         Net Cash Flow - Investing                                     (0.01)     (0.01)     (0.21)     (0.07)     (0.30)
         Net Cash Flow - Financing                                     0.63        3.32       0.60       3.56       8.11

         Source: Capital IQ


         PRICE / VOLUME


                                                                                        Source: Channelchek/QuoteMedia

              Noble Capital Markets' Twenty-First Annual Emerging Growth Equity Conference
   98   99   100   101   102   103   104   105   106   107   108