
Page 113 - NobleCon21
P. 113
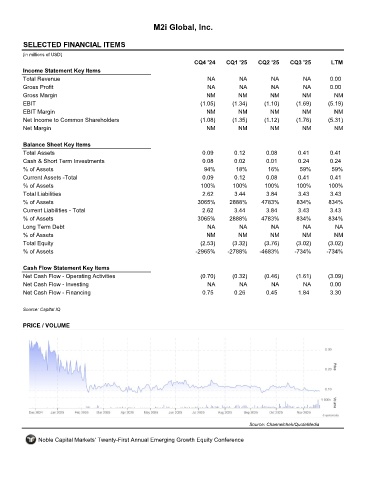
M2i Global, Inc.


         SELECTED FINANCIAL ITEMS                                 MTWO
         (in millions of USD)
                                                                     CQ4 '24    CQ1 '25    CQ2 '25    CQ3 '25       LTM
         Income Statement Key Items
         Total Revenue                                                   NA         NA         NA          NA       0.00
         Gross Profit                                                    NA         NA         NA          NA       0.00
         Gross Margin                                                    NM         NM         NM         NM         NM
         EBIT                                                          (1.05)     (1.34)     (1.10)     (1.69)     (5.19)
         EBIT Margin                                                     NM         NM         NM         NM         NM
         Net Income to Common Shareholders                             (1.08)     (1.35)     (1.12)     (1.76)     (5.31)
         Net Margin                                                      NM         NM         NM         NM         NM

         Balance Sheet Key Items
         Total Assets                                                  0.09        0.12       0.08       0.41       0.41
         Cash & Short Term Investments                                 0.08        0.02       0.01       0.24       0.24
         % of Assets                                                    94%        18%        16%        59%         59%
         Current Assets -Total                                         0.09        0.12       0.08       0.41       0.41
         % of Assets                                                   100%       100%       100%       100%       100%
         Total Liabilities                                             2.62        3.44       3.84       3.43       3.43
         % of Assets                                                  3065%      2888%      4783%       834%       834%
         Current Liabilities - Total                                   2.62        3.44       3.84       3.43       3.43
         % of Assets                                                  3065%      2888%      4783%       834%       834%
         Long Term Debt                                                  NA         NA         NA          NA         NA
         % of Assets                                                     NM         NM         NM         NM         NM
         Total Equity                                                  (2.53)     (3.32)     (3.76)     (3.02)     (3.02)
         % of Assets                                                 -2965%     -2788%     -4683%       -734%      -734%

         Cash Flow Statement Key Items
         Net Cash Flow - Operating Activities                          (0.70)     (0.32)     (0.46)     (1.61)     (3.09)
         Net Cash Flow - Investing                                       NA         NA         NA          NA       0.00
         Net Cash Flow - Financing                                     0.75        0.26       0.45       1.84       3.30

         Source: Capital IQ


         PRICE / VOLUME


                                                                                        Source: Channelchek/QuoteMedia

              Noble Capital Markets' Twenty-First Annual Emerging Growth Equity Conference