
Page 117 - NobleCon21
P. 117
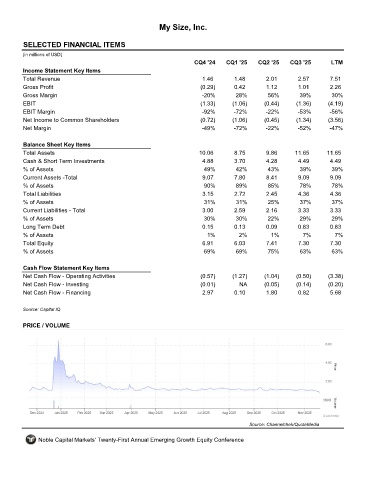
My Size, Inc.


         SELECTED FINANCIAL ITEMS                                 MYSZ
         (in millions of USD)
                                                                     CQ4 '24    CQ1 '25    CQ2 '25    CQ3 '25       LTM
         Income Statement Key Items
         Total Revenue                                                 1.46        1.48       2.01       2.57       7.51
         Gross Profit                                                  (0.29)      0.42       1.12       1.01       2.26
         Gross Margin                                                  -20%        28%        56%        39%        30%
         EBIT                                                          (1.33)     (1.06)     (0.44)     (1.36)     (4.19)
         EBIT Margin                                                   -92%       -72%        -22%       -53%       -56%
         Net Income to Common Shareholders                             (0.72)     (1.06)     (0.45)     (1.34)     (3.56)
         Net Margin                                                    -49%       -72%        -22%       -52%       -47%

         Balance Sheet Key Items
         Total Assets                                                 10.06        8.75       9.86      11.65      11.65
         Cash & Short Term Investments                                 4.88        3.70       4.28       4.49       4.49
         % of Assets                                                    49%        42%        43%        39%         39%
         Current Assets -Total                                         9.07        7.80       8.41       9.09       9.09
         % of Assets                                                    90%        89%        85%        78%         78%
         Total Liabilities                                             3.15        2.72       2.45       4.36       4.36
         % of Assets                                                    31%        31%        25%        37%         37%
         Current Liabilities - Total                                   3.00        2.59       2.16       3.33       3.33
         % of Assets                                                    30%        30%        22%        29%        29%
         Long Term Debt                                                0.15        0.13       0.09       0.83       0.83
         % of Assets                                                     1%         2%         1%         7%          7%
         Total Equity                                                  6.91        6.03       7.41       7.30       7.30
         % of Assets                                                    69%        69%        75%        63%        63%

         Cash Flow Statement Key Items
         Net Cash Flow - Operating Activities                          (0.57)     (1.27)     (1.04)     (0.50)     (3.38)
         Net Cash Flow - Investing                                     (0.01)       NA       (0.05)     (0.14)     (0.20)
         Net Cash Flow - Financing                                     2.97        0.10       1.80       0.82       5.68

         Source: Capital IQ


         PRICE / VOLUME


                                                                                        Source: Channelchek/QuoteMedia

              Noble Capital Markets' Twenty-First Annual Emerging Growth Equity Conference