
Page 119 - NobleCon21
P. 119
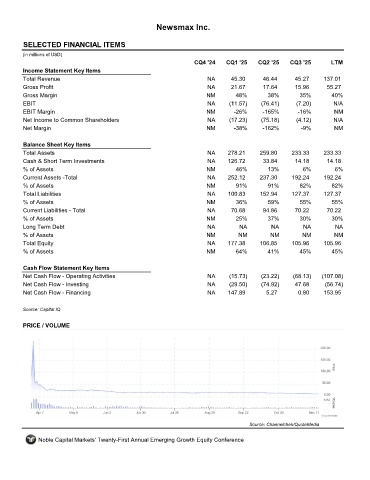
Newsmax Inc.


         SELECTED FINANCIAL ITEMS                                 NMAX
         (in millions of USD)
                                                                     CQ4 '24    CQ1 '25    CQ2 '25    CQ3 '25       LTM
         Income Statement Key Items
         Total Revenue                                                   NA      45.30       46.44      45.27     137.01
         Gross Profit                                                    NA      21.67       17.64      15.96      55.27
         Gross Margin                                                    NM        48%        38%        35%        40%
         EBIT                                                            NA      (11.57)    (76.41)     (7.20)       N/A
         EBIT Margin                                                     NM       -26%      -165%        -16%        NM
         Net Income to Common Shareholders                               NA      (17.23)    (75.18)     (4.12)       N/A
         Net Margin                                                      NM       -38%      -162%         -9%        NM

         Balance Sheet Key Items
         Total Assets                                                    NA     278.21     259.80      233.33     233.33
         Cash & Short Term Investments                                   NA     126.72       33.84      14.18      14.18
         % of Assets                                                     NM        46%        13%          6%         6%
         Current Assets -Total                                           NA     252.12     237.30      192.24     192.24
         % of Assets                                                     NM        91%        91%        82%         82%
         Total Liabilities                                               NA     100.83      152.94     127.37     127.37
         % of Assets                                                     NM        36%        59%        55%         55%
         Current Liabilities - Total                                     NA      70.68       94.86      70.22      70.22
         % of Assets                                                     NM        25%        37%        30%        30%
         Long Term Debt                                                  NA         NA         NA          NA         NA
         % of Assets                                                     NM         NM         NM         NM         NM
         Total Equity                                                    NA     177.38     106.85      105.96     105.96
         % of Assets                                                     NM        64%        41%        45%        45%

         Cash Flow Statement Key Items
         Net Cash Flow - Operating Activities                            NA      (15.73)    (23.22)    (68.13)   (107.08)
         Net Cash Flow - Investing                                       NA      (29.50)    (74.92)     47.68     (56.74)
         Net Cash Flow - Financing                                       NA     147.89        5.27       0.80     153.95

         Source: Capital IQ


         PRICE / VOLUME


                                                                                        Source: Channelchek/QuoteMedia

              Noble Capital Markets' Twenty-First Annual Emerging Growth Equity Conference