
Page 115 - NobleCon21
P. 115
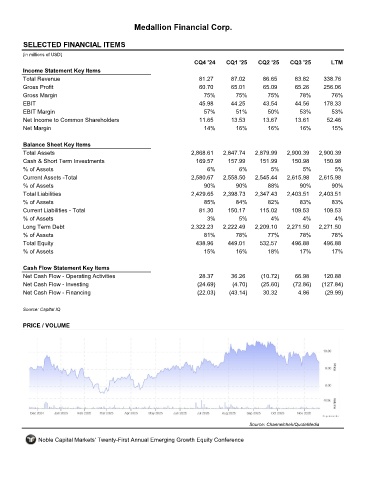
Medallion Financial Corp.


         SELECTED FINANCIAL ITEMS                                 MFIN
         (in millions of USD)
                                                                     CQ4 '24    CQ1 '25    CQ2 '25    CQ3 '25       LTM
         Income Statement Key Items
         Total Revenue                                                81.27      87.02       86.65      83.82     338.76
         Gross Profit                                                 60.70      65.01       65.09      65.26     256.06
         Gross Margin                                                   75%        75%        75%        78%        76%
         EBIT                                                         45.98      44.25       43.54      44.56     178.33
         EBIT Margin                                                    57%        51%        50%        53%        53%
         Net Income to Common Shareholders                            11.65      13.53       13.67      13.61      52.46
         Net Margin                                                     14%        16%        16%        16%         15%

         Balance Sheet Key Items
         Total Assets                                               2,868.61   2,847.74   2,879.99   2,900.39   2,900.39
         Cash & Short Term Investments                               169.57     157.99      151.99     150.98     150.98
         % of Assets                                                     6%         6%         5%          5%         5%
         Current Assets -Total                                      2,580.67   2,558.50   2,545.44   2,615.98   2,615.98
         % of Assets                                                    90%        90%        88%        90%         90%
         Total Liabilities                                          2,429.65   2,398.73   2,347.43   2,403.51   2,403.51
         % of Assets                                                    85%        84%        82%        83%         83%
         Current Liabilities - Total                                  81.30     150.17     115.02      109.53     109.53
         % of Assets                                                     3%         5%         4%         4%          4%
         Long Term Debt                                             2,322.23   2,222.49   2,209.10   2,271.50   2,271.50
         % of Assets                                                    81%        78%        77%        78%        78%
         Total Equity                                                438.96     449.01     532.57      496.88     496.88
         % of Assets                                                    15%        16%        18%        17%        17%

         Cash Flow Statement Key Items
         Net Cash Flow - Operating Activities                         28.37      36.26      (10.72)     66.98     120.88
         Net Cash Flow - Investing                                    (24.69)     (4.70)    (25.60)    (72.86)   (127.84)
         Net Cash Flow - Financing                                    (22.03)    (43.14)     30.32       4.86     (29.99)

         Source: Capital IQ


         PRICE / VOLUME


                                                                                        Source: Channelchek/QuoteMedia

              Noble Capital Markets' Twenty-First Annual Emerging Growth Equity Conference