Page 181 - NobleCon21
P. 181

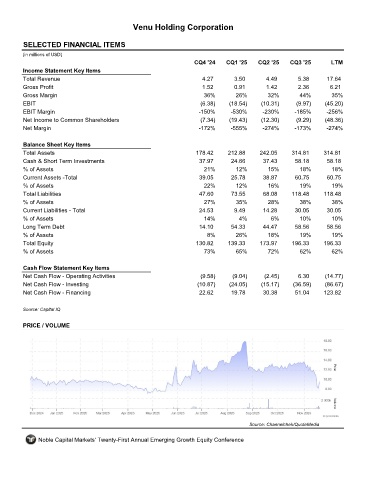
Venu Holding Corporation


         SELECTED FINANCIAL ITEMS                                 VENU
         (in millions of USD)
                                                                     CQ4 '24    CQ1 '25    CQ2 '25    CQ3 '25       LTM
         Income Statement Key Items
         Total Revenue                                                 4.27        3.50       4.49       5.38      17.64
         Gross Profit                                                  1.52        0.91       1.42       2.36       6.21
         Gross Margin                                                   36%        26%        32%        44%        35%
         EBIT                                                          (6.38)    (18.54)    (10.31)     (9.97)    (45.20)
         EBIT Margin                                                  -150%      -530%      -230%       -185%      -256%
         Net Income to Common Shareholders                             (7.34)    (19.43)    (12.30)     (9.29)    (48.36)
         Net Margin                                                   -172%      -555%      -274%       -173%      -274%

         Balance Sheet Key Items
         Total Assets                                                178.42     212.88     242.05      314.81     314.81
         Cash & Short Term Investments                                37.97      24.66       37.43      58.18      58.18
         % of Assets                                                    21%        12%        15%        18%         18%
         Current Assets -Total                                        39.05      25.78       38.87      60.75      60.75
         % of Assets                                                    22%        12%        16%        19%         19%
         Total Liabilities                                            47.60       73.55      68.08     118.48     118.48
         % of Assets                                                    27%        35%        28%        38%         38%
         Current Liabilities - Total                                  24.53        9.49      14.28      30.05      30.05
         % of Assets                                                    14%         4%         6%        10%        10%
         Long Term Debt                                               14.10      54.33       44.47      58.56      58.56
         % of Assets                                                     8%        26%        18%        19%        19%
         Total Equity                                                130.82     139.33     173.97      196.33     196.33
         % of Assets                                                    73%        65%        72%        62%        62%

         Cash Flow Statement Key Items
         Net Cash Flow - Operating Activities                          (9.58)     (9.04)     (2.45)      6.30     (14.77)
         Net Cash Flow - Investing                                    (10.87)    (24.05)    (15.17)    (36.59)    (86.67)
         Net Cash Flow - Financing                                    22.62      19.78       30.38      51.04     123.82

         Source: Capital IQ


         PRICE / VOLUME


                                                                                        Source: Channelchek/QuoteMedia

              Noble Capital Markets' Twenty-First Annual Emerging Growth Equity Conference
   176   177   178   179   180   181   182   183   184   185   186