
Page 177 - NobleCon21
P. 177
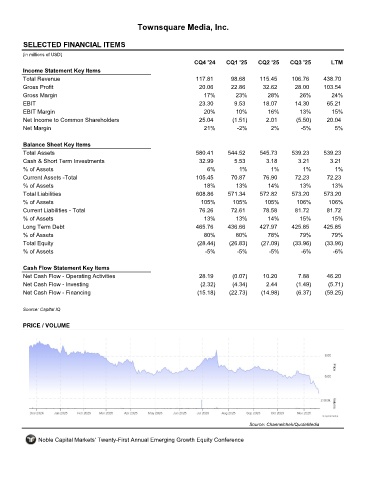
Townsquare Media, Inc.


         SELECTED FINANCIAL ITEMS                                 TSQ
         (in millions of USD)
                                                                     CQ4 '24    CQ1 '25    CQ2 '25    CQ3 '25       LTM
         Income Statement Key Items
         Total Revenue                                               117.81      98.68     115.45      106.76     438.70
         Gross Profit                                                 20.06      22.86       32.62      28.00     103.54
         Gross Margin                                                   17%        23%        28%        26%        24%
         EBIT                                                         23.30        9.53      18.07      14.30      65.21
         EBIT Margin                                                    20%        10%        16%        13%        15%
         Net Income to Common Shareholders                            25.04       (1.51)      2.01      (5.50)     20.04
         Net Margin                                                     21%         -2%        2%         -5%         5%

         Balance Sheet Key Items
         Total Assets                                                580.41     544.52     545.73      539.23     539.23
         Cash & Short Term Investments                                32.99        5.53       3.18       3.21       3.21
         % of Assets                                                     6%         1%         1%          1%         1%
         Current Assets -Total                                       105.45      70.87       76.90      72.23      72.23
         % of Assets                                                    18%        13%        14%        13%         13%
         Total Liabilities                                           608.86     571.34      572.82     573.20     573.20
         % of Assets                                                   105%       105%       105%       106%       106%
         Current Liabilities - Total                                  76.26      72.61       78.58      81.72      81.72
         % of Assets                                                    13%        13%        14%        15%        15%
         Long Term Debt                                              465.76     436.66     427.97      425.85     425.85
         % of Assets                                                    80%        80%        78%        79%        79%
         Total Equity                                                 (28.44)    (26.83)    (27.09)    (33.96)    (33.96)
         % of Assets                                                    -5%         -5%        -5%        -6%        -6%

         Cash Flow Statement Key Items
         Net Cash Flow - Operating Activities                         28.19       (0.07)     10.20       7.88      46.20
         Net Cash Flow - Investing                                     (2.32)     (4.34)      2.44      (1.49)     (5.71)
         Net Cash Flow - Financing                                    (15.18)    (22.73)    (14.98)     (6.37)    (59.25)

         Source: Capital IQ


         PRICE / VOLUME


                                                                                        Source: Channelchek/QuoteMedia

              Noble Capital Markets' Twenty-First Annual Emerging Growth Equity Conference