
Page 175 - NobleCon21
P. 175
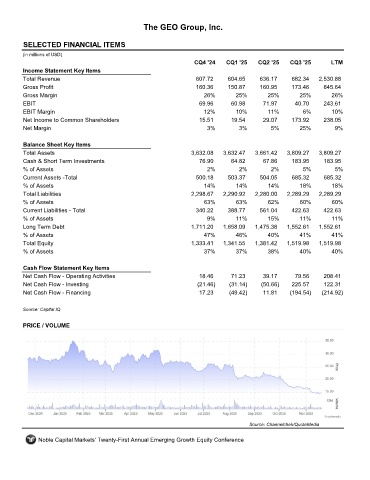
The GEO Group, Inc.


         SELECTED FINANCIAL ITEMS                                 GEO
         (in millions of USD)
                                                                     CQ4 '24    CQ1 '25    CQ2 '25    CQ3 '25       LTM
         Income Statement Key Items
         Total Revenue                                               607.72     604.65     636.17      682.34   2,530.88
         Gross Profit                                                160.36     150.87     160.95      173.46     645.64
         Gross Margin                                                   26%        25%        25%        25%        26%
         EBIT                                                         69.96      60.98       71.97      40.70     243.61
         EBIT Margin                                                    12%        10%        11%         6%        10%
         Net Income to Common Shareholders                            15.51      19.54       29.07     173.92     238.05
         Net Margin                                                      3%         3%         5%        25%          9%

         Balance Sheet Key Items
         Total Assets                                               3,632.08   3,632.47   3,661.42   3,809.27   3,809.27
         Cash & Short Term Investments                                76.90      64.82       67.86     183.95     183.95
         % of Assets                                                     2%         2%         2%          5%         5%
         Current Assets -Total                                       500.18     503.37      504.05     685.32     685.32
         % of Assets                                                    14%        14%        14%        18%         18%
         Total Liabilities                                          2,298.67   2,290.92   2,280.00   2,289.29   2,289.29
         % of Assets                                                    63%        63%        62%        60%         60%
         Current Liabilities - Total                                 340.22     388.77     561.04      422.63     422.63
         % of Assets                                                     9%        11%        15%        11%        11%
         Long Term Debt                                             1,711.20   1,658.09   1,475.38   1,552.61   1,552.61
         % of Assets                                                    47%        46%        40%        41%        41%
         Total Equity                                               1,333.41   1,341.55   1,381.42   1,519.98   1,519.98
         % of Assets                                                    37%        37%        38%        40%        40%

         Cash Flow Statement Key Items
         Net Cash Flow - Operating Activities                         18.46      71.23       39.17      79.56     208.41
         Net Cash Flow - Investing                                    (21.46)    (31.14)    (50.66)    225.57     122.31
         Net Cash Flow - Financing                                    17.23      (49.42)     11.81    (194.54)   (214.92)

         Source: Capital IQ


         PRICE / VOLUME


                                                                                        Source: Channelchek/QuoteMedia

              Noble Capital Markets' Twenty-First Annual Emerging Growth Equity Conference