Page 173 - NobleCon21
P. 173

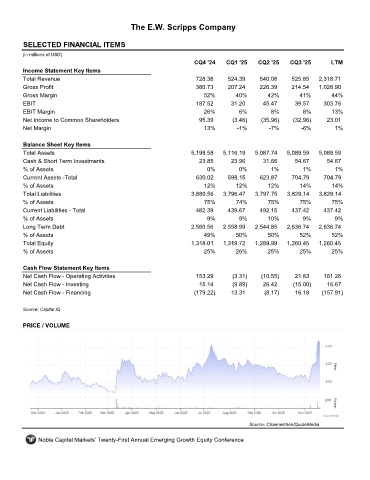
The E.W. Scripps Company


         SELECTED FINANCIAL ITEMS                                 SSP
         (in millions of USD)
                                                                     CQ4 '24    CQ1 '25    CQ2 '25    CQ3 '25       LTM
         Income Statement Key Items
         Total Revenue                                               728.38     524.39     540.08      525.85   2,318.71
         Gross Profit                                                380.73     207.24     226.39      214.54   1,028.90
         Gross Margin                                                   52%        40%        42%        41%        44%
         EBIT                                                        187.52      31.20       45.47      39.57     303.76
         EBIT Margin                                                    26%         6%         8%         8%        13%
         Net Income to Common Shareholders                            95.39       (3.46)    (35.96)    (32.96)     23.01
         Net Margin                                                     13%         -1%        -7%        -6%         1%

         Balance Sheet Key Items
         Total Assets                                               5,198.58   5,116.19   5,087.74   5,089.59   5,089.59
         Cash & Short Term Investments                                23.85      23.96       31.66      54.67      54.67
         % of Assets                                                     0%         0%         1%          1%         1%
         Current Assets -Total                                       630.02     598.15      623.87     704.79     704.79
         % of Assets                                                    12%        12%        12%        14%         14%
         Total Liabilities                                          3,880.56   3,796.47   3,797.75   3,829.14   3,829.14
         % of Assets                                                    75%        74%        75%        75%         75%
         Current Liabilities - Total                                 482.39     439.67     492.15      437.42     437.42
         % of Assets                                                     9%         9%        10%         9%          9%
         Long Term Debt                                             2,560.56   2,558.99   2,544.85   2,636.74   2,636.74
         % of Assets                                                    49%        50%        50%        52%        52%
         Total Equity                                               1,318.01   1,319.72   1,289.99   1,260.45   1,260.45
         % of Assets                                                    25%        26%        25%        25%        25%

         Cash Flow Statement Key Items
         Net Cash Flow - Operating Activities                        153.29       (3.31)    (10.55)     21.83     161.26
         Net Cash Flow - Investing                                    15.14       (9.89)     26.42     (15.00)     16.67
         Net Cash Flow - Financing                                   (179.22)    13.31       (8.17)     16.18    (157.91)

         Source: Capital IQ


         PRICE / VOLUME


                                                                                        Source: Channelchek/QuoteMedia

              Noble Capital Markets' Twenty-First Annual Emerging Growth Equity Conference
   168   169   170   171   172   173   174   175   176   177   178