Page 169 - NobleCon21
P. 169

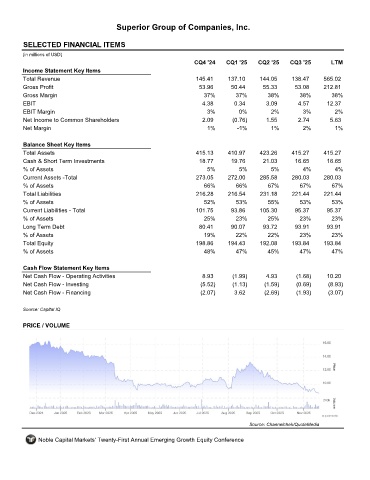
Superior Group of Companies, Inc.


         SELECTED FINANCIAL ITEMS                                 SGC
         (in millions of USD)
                                                                     CQ4 '24    CQ1 '25    CQ2 '25    CQ3 '25       LTM
         Income Statement Key Items
         Total Revenue                                               145.41     137.10     144.05      138.47     565.02
         Gross Profit                                                 53.96      50.44       55.33      53.08     212.81
         Gross Margin                                                   37%        37%        38%        38%        38%
         EBIT                                                          4.38        0.34       3.09       4.57      12.37
         EBIT Margin                                                     3%         0%         2%         3%          2%
         Net Income to Common Shareholders                             2.09       (0.76)      1.55       2.74       5.63
         Net Margin                                                      1%         -1%        1%         2%          1%

         Balance Sheet Key Items
         Total Assets                                                415.13     410.97     423.26      415.27     415.27
         Cash & Short Term Investments                                18.77      19.76       21.03      16.65      16.65
         % of Assets                                                     5%         5%         5%          4%         4%
         Current Assets -Total                                       273.05     272.00      285.58     280.03     280.03
         % of Assets                                                    66%        66%        67%        67%         67%
         Total Liabilities                                           216.28     216.54      231.18     221.44     221.44
         % of Assets                                                    52%        53%        55%        53%         53%
         Current Liabilities - Total                                 101.75      93.86     105.30       95.37      95.37
         % of Assets                                                    25%        23%        25%        23%        23%
         Long Term Debt                                               80.41      90.07       93.72      93.91      93.91
         % of Assets                                                    19%        22%        22%        23%        23%
         Total Equity                                                198.86     194.43     192.08      193.84     193.84
         % of Assets                                                    48%        47%        45%        47%        47%

         Cash Flow Statement Key Items
         Net Cash Flow - Operating Activities                          8.93       (1.99)      4.93      (1.68)     10.20
         Net Cash Flow - Investing                                     (5.52)     (1.13)     (1.59)     (0.69)     (8.93)
         Net Cash Flow - Financing                                     (2.07)      3.62      (2.69)     (1.93)     (3.07)

         Source: Capital IQ


         PRICE / VOLUME


                                                                                        Source: Channelchek/QuoteMedia

              Noble Capital Markets' Twenty-First Annual Emerging Growth Equity Conference
   164   165   166   167   168   169   170   171   172   173   174