
Page 165 - NobleCon21
P. 165
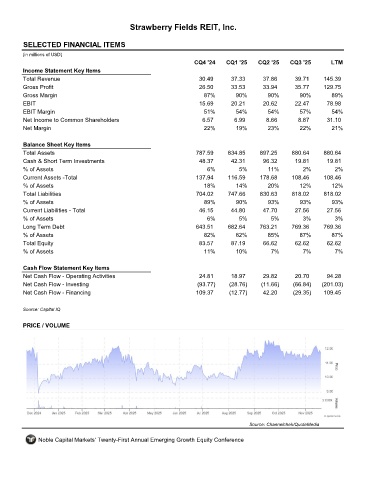
Strawberry Fields REIT, Inc.


         SELECTED FINANCIAL ITEMS                                 STRW
         (in millions of USD)
                                                                     CQ4 '24    CQ1 '25    CQ2 '25    CQ3 '25       LTM
         Income Statement Key Items
         Total Revenue                                                30.49      37.33       37.86      39.71     145.39
         Gross Profit                                                 26.50      33.53       33.94      35.77     129.75
         Gross Margin                                                   87%        90%        90%        90%        89%
         EBIT                                                         15.69      20.21       20.62      22.47      78.98
         EBIT Margin                                                    51%        54%        54%        57%        54%
         Net Income to Common Shareholders                             6.57        6.99       8.66       8.87      31.10
         Net Margin                                                     22%        19%        23%        22%         21%

         Balance Sheet Key Items
         Total Assets                                                787.59     834.85     897.25      880.64     880.64
         Cash & Short Term Investments                                48.37      42.31       96.32      19.81      19.81
         % of Assets                                                     6%         5%        11%          2%         2%
         Current Assets -Total                                       137.94     116.59      178.68     108.46     108.46
         % of Assets                                                    18%        14%        20%        12%         12%
         Total Liabilities                                           704.02     747.66      830.63     818.02     818.02
         % of Assets                                                    89%        90%        93%        93%         93%
         Current Liabilities - Total                                  46.15      44.80       47.70      27.56      27.56
         % of Assets                                                     6%         5%         5%         3%          3%
         Long Term Debt                                              643.51     682.64     763.21      769.36     769.36
         % of Assets                                                    82%        82%        85%        87%        87%
         Total Equity                                                 83.57      87.19       66.62      62.62      62.62
         % of Assets                                                    11%        10%         7%         7%          7%

         Cash Flow Statement Key Items
         Net Cash Flow - Operating Activities                         24.81      18.97       29.82      20.70      94.28
         Net Cash Flow - Investing                                    (93.77)    (28.76)    (11.66)    (66.84)   (201.03)
         Net Cash Flow - Financing                                   109.37      (12.77)     42.20     (29.35)    109.45

         Source: Capital IQ


         PRICE / VOLUME


                                                                                        Source: Channelchek/QuoteMedia

              Noble Capital Markets' Twenty-First Annual Emerging Growth Equity Conference