Page 167 - NobleCon21
P. 167

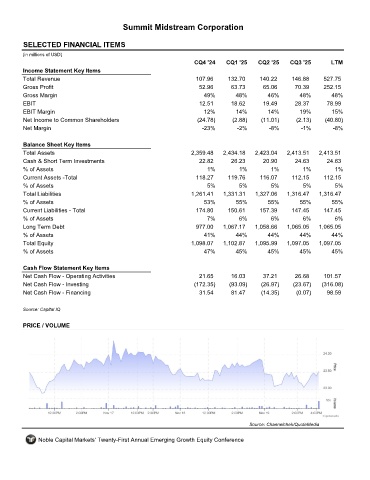
Summit Midstream Corporation


         SELECTED FINANCIAL ITEMS                                 SMC
         (in millions of USD)
                                                                     CQ4 '24    CQ1 '25    CQ2 '25    CQ3 '25       LTM
         Income Statement Key Items
         Total Revenue                                               107.96     132.70     140.22      146.88     527.75
         Gross Profit                                                 52.96      63.73       65.06      70.39     252.15
         Gross Margin                                                   49%        48%        46%        48%        48%
         EBIT                                                         12.51      18.62       19.49      28.37      78.99
         EBIT Margin                                                    12%        14%        14%        19%        15%
         Net Income to Common Shareholders                            (24.78)     (2.88)    (11.01)     (2.13)    (40.80)
         Net Margin                                                    -23%         -2%        -8%        -1%        -8%

         Balance Sheet Key Items
         Total Assets                                               2,359.48   2,434.18   2,423.04   2,413.51   2,413.51
         Cash & Short Term Investments                                22.82      26.23       20.90      24.63      24.63
         % of Assets                                                     1%         1%         1%          1%         1%
         Current Assets -Total                                       118.27     119.76      116.07     112.15     112.15
         % of Assets                                                     5%         5%         5%          5%         5%
         Total Liabilities                                          1,261.41   1,331.31   1,327.06   1,316.47   1,316.47
         % of Assets                                                    53%        55%        55%        55%         55%
         Current Liabilities - Total                                 174.80     150.61     157.39      147.45     147.45
         % of Assets                                                     7%         6%         6%         6%          6%
         Long Term Debt                                              977.00    1,067.17   1,058.66   1,065.05   1,065.05
         % of Assets                                                    41%        44%        44%        44%        44%
         Total Equity                                               1,098.07   1,102.87   1,095.99   1,097.05   1,097.05
         % of Assets                                                    47%        45%        45%        45%        45%

         Cash Flow Statement Key Items
         Net Cash Flow - Operating Activities                         21.65      16.03       37.21      26.68     101.57
         Net Cash Flow - Investing                                   (172.35)    (93.09)    (26.97)    (23.67)   (316.08)
         Net Cash Flow - Financing                                    31.54      81.47      (14.35)     (0.07)     98.59

         Source: Capital IQ


         PRICE / VOLUME


                                                                                        Source: Channelchek/QuoteMedia

              Noble Capital Markets' Twenty-First Annual Emerging Growth Equity Conference
   162   163   164   165   166   167   168   169   170   171   172