
Page 171 - NobleCon21
P. 171
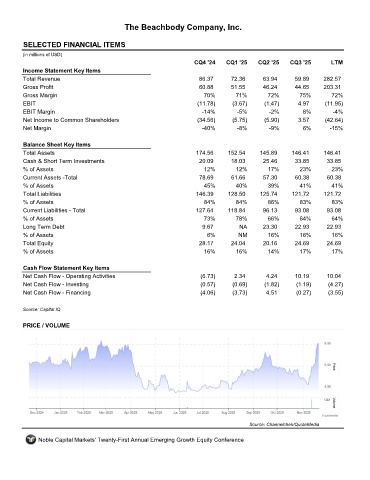
The Beachbody Company, Inc.


         SELECTED FINANCIAL ITEMS                                 BODI
         (in millions of USD)
                                                                     CQ4 '24    CQ1 '25    CQ2 '25    CQ3 '25       LTM
         Income Statement Key Items
         Total Revenue                                                86.37      72.36       63.94      59.89     282.57
         Gross Profit                                                 60.88      51.55       46.24      44.65     203.31
         Gross Margin                                                   70%        71%        72%        75%        72%
         EBIT                                                         (11.78)     (3.67)     (1.47)      4.97     (11.95)
         EBIT Margin                                                   -14%         -5%        -2%        8%         -4%
         Net Income to Common Shareholders                            (34.56)     (5.75)     (5.90)      3.57     (42.64)
         Net Margin                                                    -40%         -8%        -9%        6%        -15%

         Balance Sheet Key Items
         Total Assets                                                174.56     152.54     145.89      146.41     146.41
         Cash & Short Term Investments                                20.09      18.03       25.46      33.85      33.85
         % of Assets                                                    12%        12%        17%        23%         23%
         Current Assets -Total                                        78.69       61.66      57.30      60.38      60.38
         % of Assets                                                    45%        40%        39%        41%         41%
         Total Liabilities                                           146.39     128.50      125.74     121.72     121.72
         % of Assets                                                    84%        84%        86%        83%         83%
         Current Liabilities - Total                                 127.64     118.84       96.13      93.08      93.08
         % of Assets                                                    73%        78%        66%        64%        64%
         Long Term Debt                                                9.67         NA       23.30      22.93      22.93
         % of Assets                                                     6%         NM        16%        16%        16%
         Total Equity                                                 28.17      24.04       20.16      24.69      24.69
         % of Assets                                                    16%        16%        14%        17%        17%

         Cash Flow Statement Key Items
         Net Cash Flow - Operating Activities                          (6.73)      2.34       4.24      10.19      10.04
         Net Cash Flow - Investing                                     (0.57)     (0.69)     (1.82)     (1.19)     (4.27)
         Net Cash Flow - Financing                                     (4.06)     (3.73)      4.51      (0.27)     (3.55)

         Source: Capital IQ


         PRICE / VOLUME


                                                                                        Source: Channelchek/QuoteMedia

              Noble Capital Markets' Twenty-First Annual Emerging Growth Equity Conference