
Page 33 - NobleCon21
P. 33
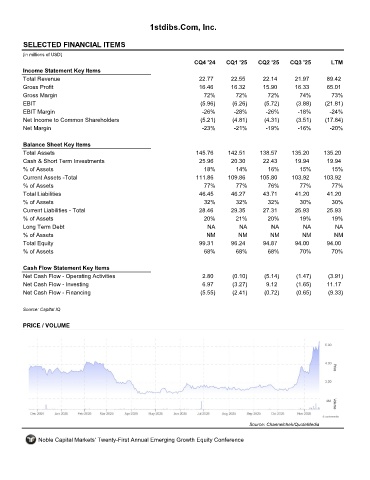
1stdibs.Com, Inc.


         SELECTED FINANCIAL ITEMS                                 DIBS
         (in millions of USD)
                                                                     CQ4 '24    CQ1 '25    CQ2 '25    CQ3 '25       LTM
         Income Statement Key Items
         Total Revenue                                                22.77      22.55       22.14      21.97      89.42
         Gross Profit                                                 16.46      16.32       15.90      16.33      65.01
         Gross Margin                                                   72%        72%        72%        74%        73%
         EBIT                                                          (5.96)     (6.26)     (5.72)     (3.88)    (21.81)
         EBIT Margin                                                   -26%       -28%        -26%       -18%       -24%
         Net Income to Common Shareholders                             (5.21)     (4.81)     (4.31)     (3.51)    (17.84)
         Net Margin                                                    -23%       -21%        -19%       -16%       -20%

         Balance Sheet Key Items
         Total Assets                                                145.76     142.51     138.57      135.20     135.20
         Cash & Short Term Investments                                25.96      20.30       22.43      19.94      19.94
         % of Assets                                                    18%        14%        16%        15%         15%
         Current Assets -Total                                       111.86     109.86      105.80     103.92     103.92
         % of Assets                                                    77%        77%        76%        77%         77%
         Total Liabilities                                            46.45       46.27      43.71      41.20      41.20
         % of Assets                                                    32%        32%        32%        30%         30%
         Current Liabilities - Total                                  28.46      29.35       27.31      25.93      25.93
         % of Assets                                                    20%        21%        20%        19%        19%
         Long Term Debt                                                  NA         NA         NA          NA         NA
         % of Assets                                                     NM         NM         NM         NM         NM
         Total Equity                                                 99.31      96.24       94.87      94.00      94.00
         % of Assets                                                    68%        68%        68%        70%        70%

         Cash Flow Statement Key Items
         Net Cash Flow - Operating Activities                          2.80       (0.10)     (5.14)     (1.47)     (3.91)
         Net Cash Flow - Investing                                     6.97       (3.27)      9.12      (1.65)     11.17
         Net Cash Flow - Financing                                     (5.55)     (2.41)     (0.72)     (0.65)     (9.33)

         Source: Capital IQ


         PRICE / VOLUME


                                                                                        Source: Channelchek/QuoteMedia

              Noble Capital Markets' Twenty-First Annual Emerging Growth Equity Conference