
Page 37 - NobleCon21
P. 37
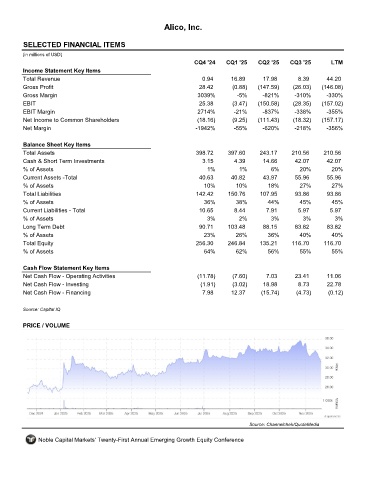
Alico, Inc.


         SELECTED FINANCIAL ITEMS                                 ALCO
         (in millions of USD)
                                                                     CQ4 '24    CQ1 '25    CQ2 '25    CQ3 '25       LTM
         Income Statement Key Items
         Total Revenue                                                 0.94      16.89       17.98       8.39      44.20
         Gross Profit                                                 28.42       (0.88)   (147.59)    (26.03)   (146.08)
         Gross Margin                                                 3039%         -5%     -821%       -310%      -330%
         EBIT                                                         25.38       (3.47)   (150.58)    (28.35)   (157.02)
         EBIT Margin                                                  2714%       -21%      -837%       -338%      -355%
         Net Income to Common Shareholders                            (18.16)     (9.25)   (111.43)    (18.32)   (157.17)
         Net Margin                                                  -1942%       -55%      -620%       -218%      -356%

         Balance Sheet Key Items
         Total Assets                                                398.72     397.60     243.17      210.56     210.56
         Cash & Short Term Investments                                 3.15        4.39      14.66      42.07      42.07
         % of Assets                                                     1%         1%         6%        20%         20%
         Current Assets -Total                                        40.63      40.82       43.97      55.96      55.96
         % of Assets                                                    10%        10%        18%        27%         27%
         Total Liabilities                                           142.42     150.76      107.95      93.86      93.86
         % of Assets                                                    36%        38%        44%        45%         45%
         Current Liabilities - Total                                  10.65        8.44       7.91       5.97       5.97
         % of Assets                                                     3%         2%         3%         3%          3%
         Long Term Debt                                               90.71     103.48       88.15      83.82      83.82
         % of Assets                                                    23%        26%        36%        40%        40%
         Total Equity                                                256.30     246.84     135.21      116.70     116.70
         % of Assets                                                    64%        62%        56%        55%        55%

         Cash Flow Statement Key Items
         Net Cash Flow - Operating Activities                         (11.78)     (7.60)      7.03      23.41      11.06
         Net Cash Flow - Investing                                     (1.91)     (3.02)     18.98       8.73      22.78
         Net Cash Flow - Financing                                     7.98      12.37      (15.74)     (4.73)     (0.12)

         Source: Capital IQ


         PRICE / VOLUME


                                                                                        Source: Channelchek/QuoteMedia

              Noble Capital Markets' Twenty-First Annual Emerging Growth Equity Conference