Page 41 - NobleCon21
P. 41

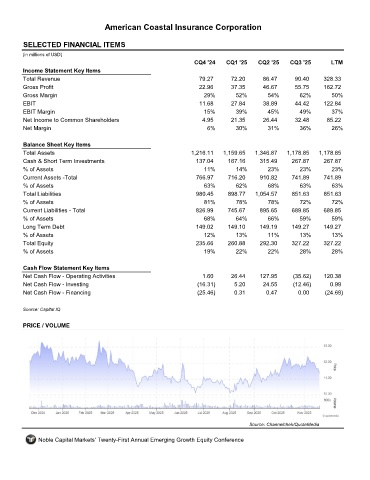
American Coastal Insurance Corporation


         SELECTED FINANCIAL ITEMS                                 ACIC
         (in millions of USD)
                                                                     CQ4 '24    CQ1 '25    CQ2 '25    CQ3 '25       LTM
         Income Statement Key Items
         Total Revenue                                                79.27      72.20       86.47      90.40     328.33
         Gross Profit                                                 22.96      37.35       46.67      55.75     162.72
         Gross Margin                                                   29%        52%        54%        62%        50%
         EBIT                                                         11.68      27.84       38.89      44.42     122.84
         EBIT Margin                                                    15%        39%        45%        49%        37%
         Net Income to Common Shareholders                             4.95      21.35       26.44      32.48      85.22
         Net Margin                                                      6%        30%        31%        36%         26%

         Balance Sheet Key Items
         Total Assets                                               1,216.11   1,159.65   1,346.87   1,178.85   1,178.85
         Cash & Short Term Investments                               137.04     167.16     315.49      267.87     267.87
         % of Assets                                                    11%        14%        23%        23%         23%
         Current Assets -Total                                       766.97     716.20      910.82     741.89     741.89
         % of Assets                                                    63%        62%        68%        63%         63%
         Total Liabilities                                           980.45     898.77    1,054.57     851.63     851.63
         % of Assets                                                    81%        78%        78%        72%         72%
         Current Liabilities - Total                                 826.99     745.67     895.65      689.85     689.85
         % of Assets                                                    68%        64%        66%        59%        59%
         Long Term Debt                                              149.02     149.10     149.19      149.27     149.27
         % of Assets                                                    12%        13%        11%        13%        13%
         Total Equity                                                235.66     260.88     292.30      327.22     327.22
         % of Assets                                                    19%        22%        22%        28%        28%

         Cash Flow Statement Key Items
         Net Cash Flow - Operating Activities                          1.60      26.44     127.95      (35.62)    120.38
         Net Cash Flow - Investing                                    (16.31)      5.20      24.55     (12.46)      0.99
         Net Cash Flow - Financing                                    (25.46)      0.31       0.47       0.00     (24.69)

         Source: Capital IQ


         PRICE / VOLUME


                                                                                        Source: Channelchek/QuoteMedia

              Noble Capital Markets' Twenty-First Annual Emerging Growth Equity Conference
   36   37   38   39   40   41   42   43   44   45   46