Page 43 - NobleCon21
P. 43

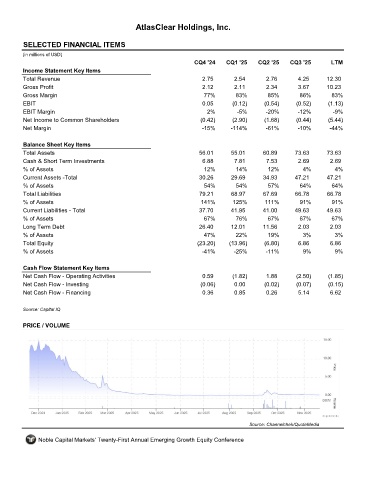
AtlasClear Holdings, Inc.


         SELECTED FINANCIAL ITEMS                                 ATCH
         (in millions of USD)
                                                                     CQ4 '24    CQ1 '25    CQ2 '25    CQ3 '25       LTM
         Income Statement Key Items
         Total Revenue                                                 2.75        2.54       2.76       4.25      12.30
         Gross Profit                                                  2.12        2.11       2.34       3.67      10.23
         Gross Margin                                                   77%        83%        85%        86%        83%
         EBIT                                                          0.05       (0.12)     (0.54)     (0.52)     (1.13)
         EBIT Margin                                                     2%         -5%       -20%       -12%        -9%
         Net Income to Common Shareholders                             (0.42)     (2.90)     (1.68)     (0.44)     (5.44)
         Net Margin                                                    -15%      -114%        -61%       -10%       -44%

         Balance Sheet Key Items
         Total Assets                                                 56.01      55.01       60.89      73.63      73.63
         Cash & Short Term Investments                                 6.88        7.81       7.53       2.69       2.69
         % of Assets                                                    12%        14%        12%          4%         4%
         Current Assets -Total                                        30.26      29.69       34.93      47.21      47.21
         % of Assets                                                    54%        54%        57%        64%         64%
         Total Liabilities                                            79.21       68.97      67.69      66.78      66.78
         % of Assets                                                   141%       125%       111%        91%         91%
         Current Liabilities - Total                                  37.70      41.95       41.00      49.63      49.63
         % of Assets                                                    67%        76%        67%        67%        67%
         Long Term Debt                                               26.40      12.01       11.56       2.03       2.03
         % of Assets                                                    47%        22%        19%         3%          3%
         Total Equity                                                 (23.20)    (13.96)     (6.80)      6.86       6.86
         % of Assets                                                   -41%       -25%        -11%        9%          9%

         Cash Flow Statement Key Items
         Net Cash Flow - Operating Activities                          0.59       (1.82)      1.88      (2.50)     (1.85)
         Net Cash Flow - Investing                                     (0.06)      0.00      (0.02)     (0.07)     (0.15)
         Net Cash Flow - Financing                                     0.36        0.85       0.26       5.14       6.62

         Source: Capital IQ


         PRICE / VOLUME


                                                                                        Source: Channelchek/QuoteMedia

              Noble Capital Markets' Twenty-First Annual Emerging Growth Equity Conference
   38   39   40   41   42   43   44   45   46   47   48