
Page 47 - NobleCon21
P. 47
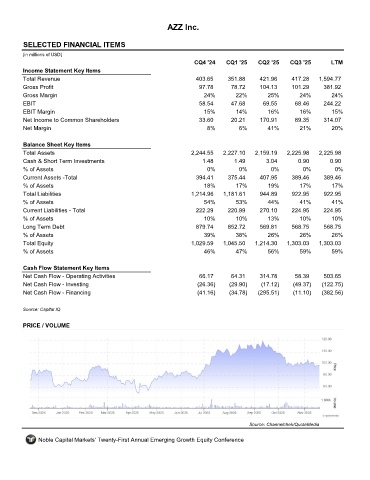
AZZ Inc.


         SELECTED FINANCIAL ITEMS                                 AZZ
         (in millions of USD)
                                                                     CQ4 '24    CQ1 '25    CQ2 '25    CQ3 '25       LTM
         Income Statement Key Items
         Total Revenue                                               403.65     351.88     421.96      417.28   1,594.77
         Gross Profit                                                 97.78      78.72     104.13      101.29     381.92
         Gross Margin                                                   24%        22%        25%        24%        24%
         EBIT                                                         58.54      47.68       69.55      68.46     244.22
         EBIT Margin                                                    15%        14%        16%        16%        15%
         Net Income to Common Shareholders                            33.60      20.21     170.91       89.35     314.07
         Net Margin                                                      8%         6%        41%        21%         20%

         Balance Sheet Key Items
         Total Assets                                               2,244.55   2,227.10   2,159.19   2,225.98   2,225.98
         Cash & Short Term Investments                                 1.48        1.49       3.04       0.90       0.90
         % of Assets                                                     0%         0%         0%          0%         0%
         Current Assets -Total                                       394.41     375.44      407.95     389.46     389.46
         % of Assets                                                    18%        17%        19%        17%         17%
         Total Liabilities                                          1,214.96   1,181.61     944.89     922.95     922.95
         % of Assets                                                    54%        53%        44%        41%         41%
         Current Liabilities - Total                                 222.29     220.99     270.10      224.95     224.95
         % of Assets                                                    10%        10%        13%        10%        10%
         Long Term Debt                                              879.74     852.72     569.81      568.75     568.75
         % of Assets                                                    39%        38%        26%        26%        26%
         Total Equity                                               1,029.59   1,045.50   1,214.30   1,303.03   1,303.03
         % of Assets                                                    46%        47%        56%        59%        59%

         Cash Flow Statement Key Items
         Net Cash Flow - Operating Activities                         66.17      64.31     314.78       58.39     503.65
         Net Cash Flow - Investing                                    (26.36)    (29.90)    (17.12)    (49.37)   (122.75)
         Net Cash Flow - Financing                                    (41.16)    (34.78)   (295.51)    (11.10)   (382.56)

         Source: Capital IQ


         PRICE / VOLUME


                                                                                        Source: Channelchek/QuoteMedia

              Noble Capital Markets' Twenty-First Annual Emerging Growth Equity Conference