
Page 49 - NobleCon21
P. 49
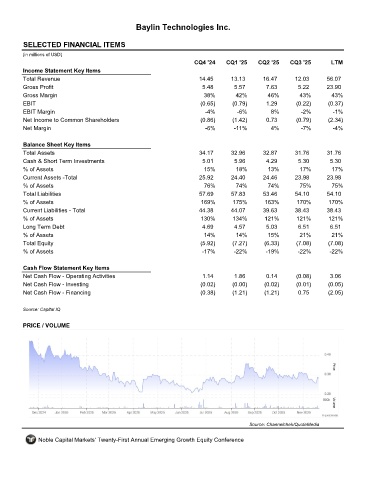
Baylin Technologies Inc.


         SELECTED FINANCIAL ITEMS                                 TSX:BYL
         (in millions of USD)
                                                                     CQ4 '24    CQ1 '25    CQ2 '25    CQ3 '25       LTM
         Income Statement Key Items
         Total Revenue                                                14.45      13.13       16.47      12.03      56.07
         Gross Profit                                                  5.48        5.57       7.63       5.22      23.90
         Gross Margin                                                   38%        42%        46%        43%        43%
         EBIT                                                          (0.65)     (0.79)      1.29      (0.22)     (0.37)
         EBIT Margin                                                    -4%         -6%        8%         -2%        -1%
         Net Income to Common Shareholders                             (0.86)     (1.42)      0.73      (0.79)     (2.34)
         Net Margin                                                     -6%       -11%         4%         -7%        -4%

         Balance Sheet Key Items
         Total Assets                                                 34.17      32.96       32.87      31.76      31.76
         Cash & Short Term Investments                                 5.01        5.96       4.29       5.30       5.30
         % of Assets                                                    15%        18%        13%        17%         17%
         Current Assets -Total                                        25.92      24.40       24.46      23.98      23.98
         % of Assets                                                    76%        74%        74%        75%         75%
         Total Liabilities                                            57.69       57.83      53.46      54.10      54.10
         % of Assets                                                   169%       175%       163%       170%       170%
         Current Liabilities - Total                                  44.38      44.07       39.63      38.43      38.43
         % of Assets                                                   130%       134%       121%       121%       121%
         Long Term Debt                                                4.69        4.57       5.03       6.51       6.51
         % of Assets                                                    14%        14%        15%        21%        21%
         Total Equity                                                  (5.92)     (7.27)     (6.33)     (7.08)     (7.08)
         % of Assets                                                   -17%       -22%        -19%       -22%       -22%

         Cash Flow Statement Key Items
         Net Cash Flow - Operating Activities                          1.14        1.86       0.14      (0.08)      3.06
         Net Cash Flow - Investing                                     (0.02)     (0.00)     (0.02)     (0.01)     (0.05)
         Net Cash Flow - Financing                                     (0.38)     (1.21)     (1.21)      0.75      (2.05)

         Source: Capital IQ


         PRICE / VOLUME


                                                                                        Source: Channelchek/QuoteMedia

              Noble Capital Markets' Twenty-First Annual Emerging Growth Equity Conference