Page 51 - NobleCon21
P. 51

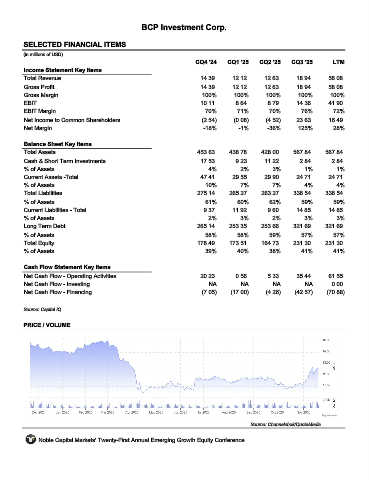
BCP Investment Corp.


         SELECTED FINANCIAL ITEMS                                 BCIC
         (in millions of USD)
                                                                     CQ4 '24    CQ1 '25    CQ2 '25    CQ3 '25       LTM
         Income Statement Key Items
         Total Revenue                                                14.39      12.12       12.63      18.94      58.08
         Gross Profit                                                 14.39      12.12       12.63      18.94      58.08
         Gross Margin                                                  100%       100%       100%       100%       100%
         EBIT                                                         10.11        8.64       8.79      14.36      41.90
         EBIT Margin                                                    70%        71%        70%        76%        72%
         Net Income to Common Shareholders                             (2.54)     (0.08)     (4.52)     23.63      16.49
         Net Margin                                                    -18%         -1%       -36%      125%         28%

         Balance Sheet Key Items
         Total Assets                                                453.63     438.78     428.00      567.84     567.84
         Cash & Short Term Investments                                17.53        9.23      11.22       2.84       2.84
         % of Assets                                                     4%         2%         3%          1%         1%
         Current Assets -Total                                        47.41       29.55      29.90      24.71      24.71
         % of Assets                                                    10%         7%         7%          4%         4%
         Total Liabilities                                           275.14     265.27      263.27     336.54     336.54
         % of Assets                                                    61%        60%        62%        59%         59%
         Current Liabilities - Total                                   9.37      11.92        9.60      14.85      14.85
         % of Assets                                                     2%         3%         2%         3%          3%
         Long Term Debt                                              265.14     253.35     253.66      321.69     321.69
         % of Assets                                                    58%        58%        59%        57%        57%
         Total Equity                                                178.49     173.51     164.73      231.30     231.30
         % of Assets                                                    39%        40%        38%        41%        41%

         Cash Flow Statement Key Items
         Net Cash Flow - Operating Activities                         20.23        0.56       5.33      35.44      61.55
         Net Cash Flow - Investing                                       NA         NA         NA          NA       0.00
         Net Cash Flow - Financing                                     (7.05)    (17.00)     (4.26)    (42.57)    (70.88)

         Source: Capital IQ


         PRICE / VOLUME


                                                                                        Source: Channelchek/QuoteMedia

              Noble Capital Markets' Twenty-First Annual Emerging Growth Equity Conference
   46   47   48   49   50   51   52   53   54   55   56