
Page 55 - NobleCon21
P. 55
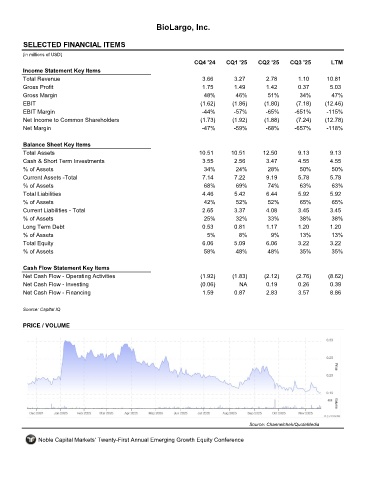
BioLargo, Inc.


         SELECTED FINANCIAL ITEMS                                 BLGO
         (in millions of USD)
                                                                     CQ4 '24    CQ1 '25    CQ2 '25    CQ3 '25       LTM
         Income Statement Key Items
         Total Revenue                                                 3.66        3.27       2.78       1.10      10.81
         Gross Profit                                                  1.75        1.49       1.42       0.37       5.03
         Gross Margin                                                   48%        46%        51%        34%        47%
         EBIT                                                          (1.62)     (1.86)     (1.80)     (7.18)    (12.46)
         EBIT Margin                                                   -44%       -57%        -65%      -651%      -115%
         Net Income to Common Shareholders                             (1.73)     (1.92)     (1.88)     (7.24)    (12.78)
         Net Margin                                                    -47%       -59%        -68%      -657%      -118%

         Balance Sheet Key Items
         Total Assets                                                 10.51      10.51       12.50       9.13       9.13
         Cash & Short Term Investments                                 3.55        2.56       3.47       4.55       4.55
         % of Assets                                                    34%        24%        28%        50%         50%
         Current Assets -Total                                         7.14        7.22       9.19       5.78       5.78
         % of Assets                                                    68%        69%        74%        63%         63%
         Total Liabilities                                             4.46        5.42       6.44       5.92       5.92
         % of Assets                                                    42%        52%        52%        65%         65%
         Current Liabilities - Total                                   2.65        3.37       4.08       3.45       3.45
         % of Assets                                                    25%        32%        33%        38%        38%
         Long Term Debt                                                0.53        0.81       1.17       1.20       1.20
         % of Assets                                                     5%         8%         9%        13%        13%
         Total Equity                                                  6.06        5.09       6.06       3.22       3.22
         % of Assets                                                    58%        48%        48%        35%        35%

         Cash Flow Statement Key Items
         Net Cash Flow - Operating Activities                          (1.92)     (1.83)     (2.12)     (2.76)     (8.62)
         Net Cash Flow - Investing                                     (0.06)       NA        0.19       0.26       0.39
         Net Cash Flow - Financing                                     1.59        0.87       2.83       3.57       8.86

         Source: Capital IQ


         PRICE / VOLUME


                                                                                        Source: Channelchek/QuoteMedia

              Noble Capital Markets' Twenty-First Annual Emerging Growth Equity Conference