Page 59 - NobleCon21
P. 59

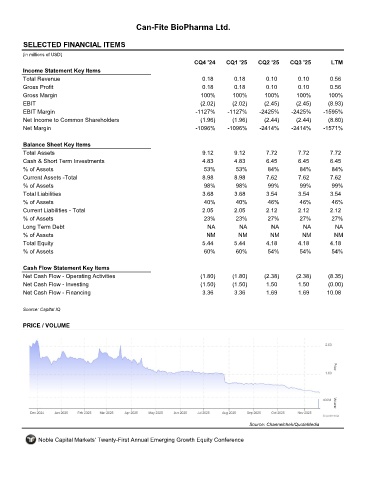
Can-Fite BioPharma Ltd.


         SELECTED FINANCIAL ITEMS                                 CANF
         (in millions of USD)
                                                                     CQ4 '24    CQ1 '25    CQ2 '25    CQ3 '25       LTM
         Income Statement Key Items
         Total Revenue                                                 0.18        0.18       0.10       0.10       0.56
         Gross Profit                                                  0.18        0.18       0.10       0.10       0.56
         Gross Margin                                                  100%       100%       100%       100%       100%
         EBIT                                                          (2.02)     (2.02)     (2.45)     (2.45)     (8.93)
         EBIT Margin                                                 -1127%     -1127%     -2425%     -2425%      -1595%
         Net Income to Common Shareholders                             (1.96)     (1.96)     (2.44)     (2.44)     (8.80)
         Net Margin                                                  -1096%     -1096%     -2414%      -2414%     -1571%

         Balance Sheet Key Items
         Total Assets                                                  9.12        9.12       7.72       7.72       7.72
         Cash & Short Term Investments                                 4.83        4.83       6.45       6.45       6.45
         % of Assets                                                    53%        53%        84%        84%         84%
         Current Assets -Total                                         8.98        8.98       7.62       7.62       7.62
         % of Assets                                                    98%        98%        99%        99%         99%
         Total Liabilities                                             3.68        3.68       3.54       3.54       3.54
         % of Assets                                                    40%        40%        46%        46%         46%
         Current Liabilities - Total                                   2.05        2.05       2.12       2.12       2.12
         % of Assets                                                    23%        23%        27%        27%        27%
         Long Term Debt                                                  NA         NA         NA          NA         NA
         % of Assets                                                     NM         NM         NM         NM         NM
         Total Equity                                                  5.44        5.44       4.18       4.18       4.18
         % of Assets                                                    60%        60%        54%        54%        54%

         Cash Flow Statement Key Items
         Net Cash Flow - Operating Activities                          (1.80)     (1.80)     (2.38)     (2.38)     (8.35)
         Net Cash Flow - Investing                                     (1.50)     (1.50)      1.50       1.50      (0.00)
         Net Cash Flow - Financing                                     3.36        3.36       1.69       1.69      10.08

         Source: Capital IQ


         PRICE / VOLUME


                                                                                        Source: Channelchek/QuoteMedia

              Noble Capital Markets' Twenty-First Annual Emerging Growth Equity Conference
   54   55   56   57   58   59   60   61   62   63   64