
Page 61 - NobleCon21
P. 61
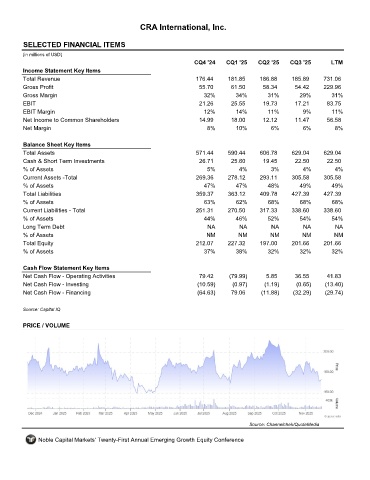
CRA International, Inc.


         SELECTED FINANCIAL ITEMS                                 CRAI
         (in millions of USD)
                                                                     CQ4 '24    CQ1 '25    CQ2 '25    CQ3 '25       LTM
         Income Statement Key Items
         Total Revenue                                               176.44     181.85     186.88      185.89     731.06
         Gross Profit                                                 55.70      61.50       58.34      54.42     229.96
         Gross Margin                                                   32%        34%        31%        29%        31%
         EBIT                                                         21.26      25.55       19.73      17.21      83.75
         EBIT Margin                                                    12%        14%        11%         9%        11%
         Net Income to Common Shareholders                            14.99      18.00       12.12      11.47      56.58
         Net Margin                                                      8%        10%         6%          6%         8%

         Balance Sheet Key Items
         Total Assets                                                571.44     590.44     606.78      629.04     629.04
         Cash & Short Term Investments                                26.71      25.60       19.45      22.50      22.50
         % of Assets                                                     5%         4%         3%          4%         4%
         Current Assets -Total                                       269.36     278.12      293.11     305.58     305.58
         % of Assets                                                    47%        47%        48%        49%         49%
         Total Liabilities                                           359.37     363.12      409.78     427.39     427.39
         % of Assets                                                    63%        62%        68%        68%         68%
         Current Liabilities - Total                                 251.31     270.50     317.33      338.60     338.60
         % of Assets                                                    44%        46%        52%        54%        54%
         Long Term Debt                                                  NA         NA         NA          NA         NA
         % of Assets                                                     NM         NM         NM         NM         NM
         Total Equity                                                212.07     227.32     197.00      201.66     201.66
         % of Assets                                                    37%        38%        32%        32%        32%

         Cash Flow Statement Key Items
         Net Cash Flow - Operating Activities                         79.42      (79.99)      5.85      36.55      41.83
         Net Cash Flow - Investing                                    (10.59)     (0.97)     (1.19)     (0.65)    (13.40)
         Net Cash Flow - Financing                                    (64.63)    79.06      (11.88)    (32.29)    (29.74)

         Source: Capital IQ


         PRICE / VOLUME


                                                                                        Source: Channelchek/QuoteMedia

              Noble Capital Markets' Twenty-First Annual Emerging Growth Equity Conference