Page 57 - NobleCon21
P. 57

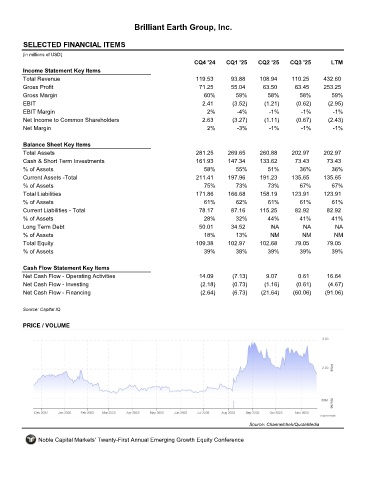
Brilliant Earth Group, Inc.


         SELECTED FINANCIAL ITEMS                                 BRLT
         (in millions of USD)
                                                                     CQ4 '24    CQ1 '25    CQ2 '25    CQ3 '25       LTM
         Income Statement Key Items
         Total Revenue                                               119.53      93.88     108.94      110.25     432.60
         Gross Profit                                                 71.25      55.04       63.50      63.45     253.25
         Gross Margin                                                   60%        59%        58%        58%        59%
         EBIT                                                          2.41       (3.52)     (1.21)     (0.62)     (2.95)
         EBIT Margin                                                     2%         -4%        -1%        -1%        -1%
         Net Income to Common Shareholders                             2.63       (3.27)     (1.11)     (0.67)     (2.43)
         Net Margin                                                      2%         -3%        -1%        -1%        -1%

         Balance Sheet Key Items
         Total Assets                                                281.25     269.65     260.88      202.97     202.97
         Cash & Short Term Investments                               161.93     147.34     133.62       73.43      73.43
         % of Assets                                                    58%        55%        51%        36%         36%
         Current Assets -Total                                       211.41     197.96      191.23     135.65     135.65
         % of Assets                                                    75%        73%        73%        67%         67%
         Total Liabilities                                           171.86     166.68      158.19     123.91     123.91
         % of Assets                                                    61%        62%        61%        61%         61%
         Current Liabilities - Total                                  78.17      87.16     115.25       82.92      82.92
         % of Assets                                                    28%        32%        44%        41%        41%
         Long Term Debt                                               50.01      34.52         NA          NA         NA
         % of Assets                                                    18%        13%         NM         NM         NM
         Total Equity                                                109.38     102.97     102.68       79.05      79.05
         % of Assets                                                    39%        38%        39%        39%        39%

         Cash Flow Statement Key Items
         Net Cash Flow - Operating Activities                         14.09       (7.13)      9.07       0.61      16.64
         Net Cash Flow - Investing                                     (2.18)     (0.73)     (1.16)     (0.61)     (4.67)
         Net Cash Flow - Financing                                     (2.64)     (6.73)    (21.64)    (60.06)    (91.06)

         Source: Capital IQ


         PRICE / VOLUME


                                                                                        Source: Channelchek/QuoteMedia

              Noble Capital Markets' Twenty-First Annual Emerging Growth Equity Conference
   52   53   54   55   56   57   58   59   60   61   62