Page 53 - NobleCon21
P. 53

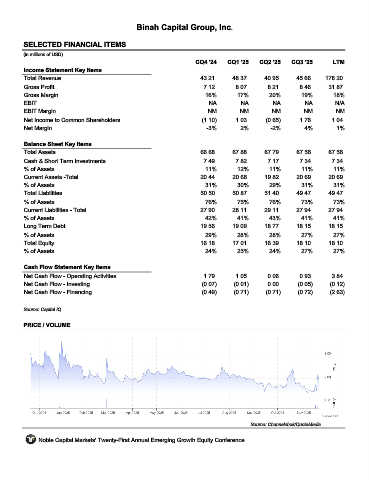
Binah Capital Group, Inc.


       SELECTED FINANCIAL ITEMS                                BCG

      (in millions of USD)
                                                                  CQ4 '24    CQ1 '25    CQ2 '25    CQ3 '25        LTM
       Income Statement Key Items
       Total Revenue                                                43.21      48.37      40.95      45.66     178.20
       Gross Profit                                                  7.12       8.07       8.21       8.46      31.87
       Gross Margin                                                  16%         17%        20%        19%        18%
       EBIT                                                            NA         NA         NA         NA         N/A
       EBIT Margin                                                    NM          NM         NM         NM         NM
       Net Income to Common Shareholders                            (1.10)      1.03       (0.65)     1.76       1.04
       Net Margin                                                     -3%         2%        -2%         4%         1%


       Balance Sheet Key Items
       Total Assets                                                 66.68      67.88      67.79      67.56      67.56
       Cash & Short Term Investments                                 7.49       7.82       7.17       7.34       7.34
       % of Assets                                                    11%        12%        11%        11%        11%
       Current Assets -Total                                        20.44      20.66      19.82      20.69      20.69
       % of Assets                                                    31%        30%        29%        31%        31%
       Total Liabilities                                            50.50      50.87      51.40      49.47      49.47
       % of Assets                                                    76%        75%        76%        73%        73%
       Current Liabilities - Total                                  27.90      28.11      29.11      27.94      27.94
       % of Assets                                                   42%         41%        43%        41%        41%
       Long Term Debt                                               19.56      19.09      18.77      18.15      18.15
       % of Assets                                                   29%         28%        28%        27%        27%
       Total Equity                                                 16.18      17.01      16.39      18.10      18.10
       % of Assets                                                    24%        25%        24%        27%        27%


       Cash Flow Statement Key Items
       Net Cash Flow - Operating Activities                          1.79       1.05       0.06       0.93       3.84
       Net Cash Flow - Investing                                    (0.07)     (0.01)      0.00       (0.05)     (0.12)
       Net Cash Flow - Financing                                    (0.49)     (0.71)      (0.71)     (0.72)     (2.63)


      Source: Capital IQ

       PRICE / VOLUME


                                                                                     Source: Channelchek/QuoteMedia

            Noble Capital Markets' Twenty-First Annual Emerging Growth Equity Conference
   48   49   50   51   52   53   54   55   56   57   58