Page 63 - NobleCon21
P. 63

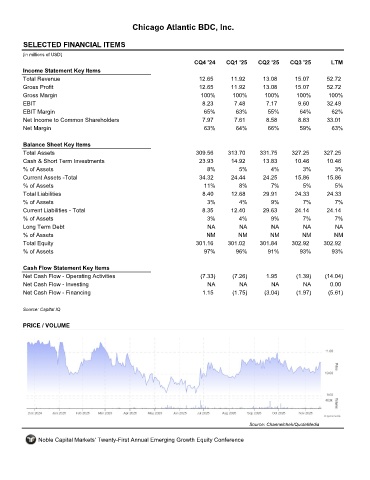
Chicago Atlantic BDC, Inc.


         SELECTED FINANCIAL ITEMS                                 LIEN
         (in millions of USD)
                                                                     CQ4 '24    CQ1 '25    CQ2 '25    CQ3 '25       LTM
         Income Statement Key Items
         Total Revenue                                                12.65      11.92       13.08      15.07      52.72
         Gross Profit                                                 12.65      11.92       13.08      15.07      52.72
         Gross Margin                                                  100%       100%       100%       100%       100%
         EBIT                                                          8.23        7.48       7.17       9.60      32.49
         EBIT Margin                                                    65%        63%        55%        64%        62%
         Net Income to Common Shareholders                             7.97        7.61       8.58       8.83      33.01
         Net Margin                                                     63%        64%        66%        59%         63%

         Balance Sheet Key Items
         Total Assets                                                309.56     313.70     331.75      327.25     327.25
         Cash & Short Term Investments                                23.93      14.92       13.83      10.46      10.46
         % of Assets                                                     8%         5%         4%          3%         3%
         Current Assets -Total                                        34.32       24.44      24.25      15.86      15.86
         % of Assets                                                    11%         8%         7%          5%         5%
         Total Liabilities                                              8.40      12.68      29.91      24.33      24.33
         % of Assets                                                     3%         4%         9%          7%         7%
         Current Liabilities - Total                                   8.35      12.40       29.63      24.14      24.14
         % of Assets                                                     3%         4%         9%         7%          7%
         Long Term Debt                                                  NA         NA         NA          NA         NA
         % of Assets                                                     NM         NM         NM         NM         NM
         Total Equity                                                301.16     301.02     301.84      302.92     302.92
         % of Assets                                                    97%        96%        91%        93%        93%

         Cash Flow Statement Key Items
         Net Cash Flow - Operating Activities                          (7.33)     (7.26)      1.95      (1.39)    (14.04)
         Net Cash Flow - Investing                                       NA         NA         NA          NA       0.00
         Net Cash Flow - Financing                                     1.15       (1.75)     (3.04)     (1.97)     (5.61)

         Source: Capital IQ


         PRICE / VOLUME


                                                                                        Source: Channelchek/QuoteMedia

              Noble Capital Markets' Twenty-First Annual Emerging Growth Equity Conference
   58   59   60   61   62   63   64   65   66   67   68