
Page 39 - NobleCon21
P. 39
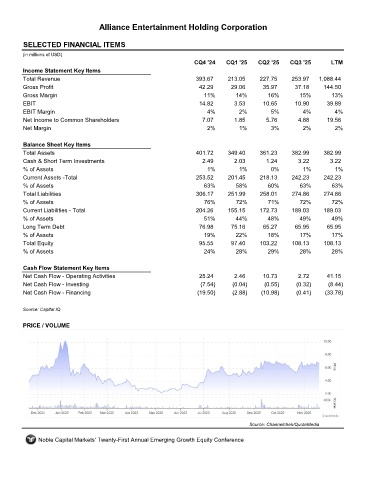
Alliance Entertainment Holding Corporation


         SELECTED FINANCIAL ITEMS                                 AENT
         (in millions of USD)
                                                                     CQ4 '24    CQ1 '25    CQ2 '25    CQ3 '25       LTM
         Income Statement Key Items
         Total Revenue                                               393.67     213.05     227.75      253.97   1,088.44
         Gross Profit                                                 42.29      29.06       35.97      37.18     144.50
         Gross Margin                                                   11%        14%        16%        15%        13%
         EBIT                                                         14.82        3.53      10.65      10.90      39.89
         EBIT Margin                                                     4%         2%         5%         4%          4%
         Net Income to Common Shareholders                             7.07        1.85       5.76       4.88      19.56
         Net Margin                                                      2%         1%         3%         2%          2%

         Balance Sheet Key Items
         Total Assets                                                401.72     349.40     361.23      382.99     382.99
         Cash & Short Term Investments                                 2.49        2.03       1.24       3.22       3.22
         % of Assets                                                     1%         1%         0%          1%         1%
         Current Assets -Total                                       253.52     201.45      218.13     242.23     242.23
         % of Assets                                                    63%        58%        60%        63%         63%
         Total Liabilities                                           306.17     251.99      258.01     274.86     274.86
         % of Assets                                                    76%        72%        71%        72%         72%
         Current Liabilities - Total                                 204.26     155.15     172.73      189.03     189.03
         % of Assets                                                    51%        44%        48%        49%        49%
         Long Term Debt                                               76.98      75.16       65.27      65.95      65.95
         % of Assets                                                    19%        22%        18%        17%        17%
         Total Equity                                                 95.55      97.40     103.22      108.13     108.13
         % of Assets                                                    24%        28%        29%        28%        28%

         Cash Flow Statement Key Items
         Net Cash Flow - Operating Activities                         25.24        2.46      10.73       2.72      41.15
         Net Cash Flow - Investing                                     (7.54)     (0.04)     (0.55)     (0.32)     (8.44)
         Net Cash Flow - Financing                                    (19.50)     (2.88)    (10.98)     (0.41)    (33.78)

         Source: Capital IQ


         PRICE / VOLUME


                                                                                        Source: Channelchek/QuoteMedia

              Noble Capital Markets' Twenty-First Annual Emerging Growth Equity Conference